Clear Sky Science · en
Agent-based framework for modeling hyperlocal urban air quality
Why city air can change from block to block
Anyone who has walked from a quiet park onto a busy road has felt how air quality can shift in just a few steps. Yet most air pollution maps still treat whole neighborhoods, or even entire cities, as if the air were evenly mixed. This paper presents a new way to trace how dirty air moves and builds up at the level of individual city blocks, opening the door to more precise health advice, smarter street design, and even cleaner daily travel routes for commuters.
Turning a city into a network of tiny neighborhoods
The researchers treat a city as a collection of small areas, or agents, that constantly trade air pollution with one another. Instead of following every puff of exhaust with detailed physics, they divide the landscape into a network of connected zones and track how much particulate pollution moves between them from one hour to the next. Each zone has its own local character, including traffic levels, land use, nearby factories, tree cover, and weather. These features are woven into a simple bookkeeping rule that keeps track of how much pollution is created, removed, or carried in and out, while still being fast enough to run on ordinary computers. 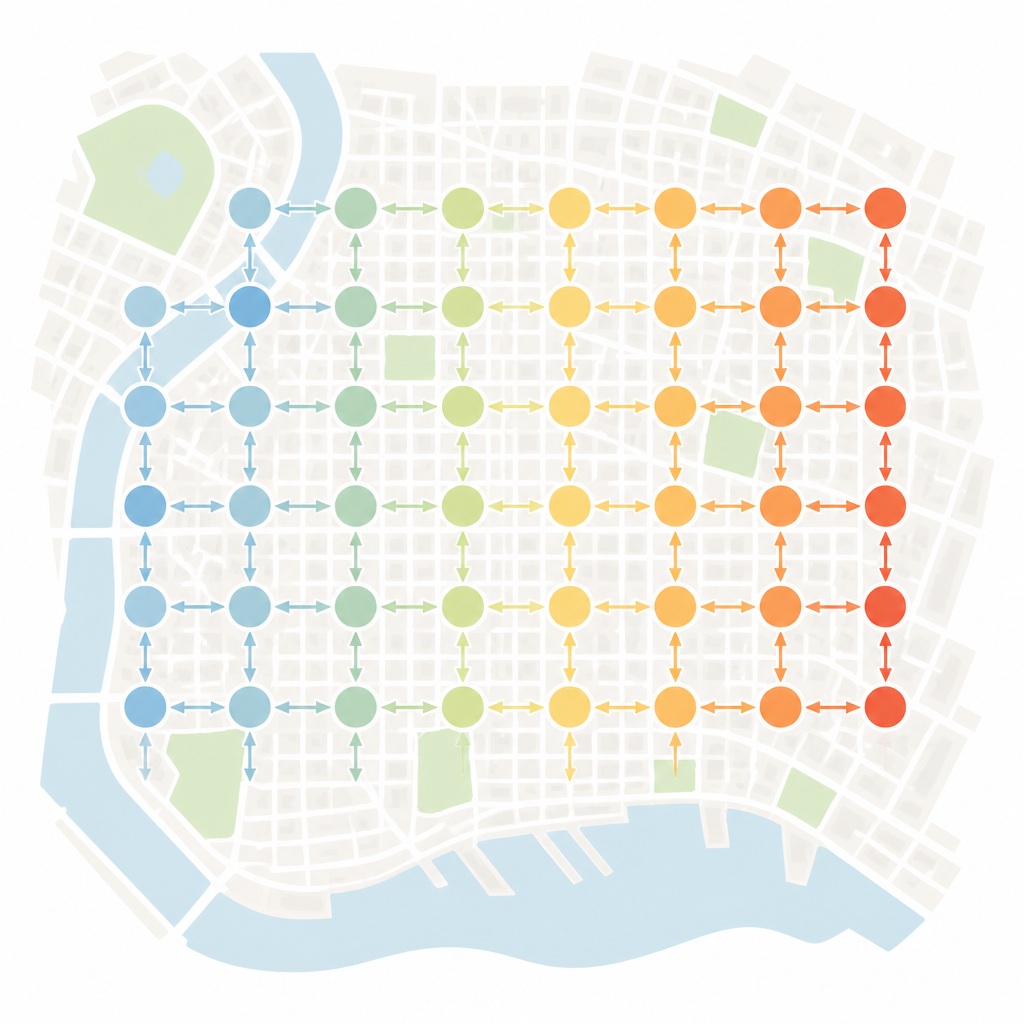
Listening separately to local sources and moving air
A key strength of this framework is that it separates two big influences on air quality. One term captures local sources and sinks, such as tailpipes, chimneys, and leafy trees that help scrub the air. A second term describes how wind and street layout move pollution between neighboring zones. By comparing these two influences, the model can say whether a hotspot is driven mainly by what happens inside that block, or by dirtier air blowing in from somewhere else. In their test case in Chennai, India, areas near schools showed sharp morning spikes linked to school traffic, while some industrial areas were more affected by pollution carried in from nearby zones.
Filling gaps and peeking into tomorrow
The same citywide network can be used as a smart prediction tool. Real air monitoring data often have missing values because sensors fail or mobile units cannot be everywhere at once. The team showed that their model can fill in these gaps more accurately than common methods that only look across time or only across space. Because it understands how zones are connected, it can guess missing values using both neighboring locations and nearby hours. The model also outperformed several standard time series techniques when asked to forecast a typical daily pollution cycle, capturing how concentrations rise and fall across the city over the course of a day.
Finding cleaner ways to move through the city
Beyond describing and predicting, the framework can help design practical responses. The authors demonstrate this by computing the “least exposure” route between two points in Chennai using their network of agents. One route is the fastest in terms of travel time, while another threads through cleaner air, based on model estimates. In their example, the cleaner route was longer and slower but cut overall pollution exposure by about one seventh, because it avoided the dirtiest streets. The same logic could guide walking, cycling, or bus routes that better protect people’s lungs. 
What this means for cleaner, healthier cities
In simple terms, this work offers a city-scale microscope for dirty air. By breaking the city into many small, connected pieces and tying each one to real-world features and weather, the model can explain where pollution is coming from, anticipate what will happen in the next hours, and test how changes in traffic, land use, or routing might reduce exposure. Although the current study focuses on one pollutant, one city, and a short time period, the approach is flexible and can be expanded to include more chemistry, more detailed weather, and different city shapes. For planners and residents alike, it provides a clearer view of how everyday choices shape the air we breathe block by block.
Citation: Swaminathan, S., Agrawal, P., McNeill, V.F. et al. Agent-based framework for modeling hyperlocal urban air quality. npj Clean Air 2, 32 (2026). https://doi.org/10.1038/s44407-026-00073-6
Keywords: urban air quality, PM2.5, agent-based model, hyperlocal pollution, city planning