Clear Sky Science · en
Volumetric non-invasive cardiac mapping for accessible global arrhythmia characterization
Seeing Heart Rhythm Problems Without Surgery
Heart rhythm disorders are common, dangerous, and often hard to pinpoint without threading catheters into the heart. This study presents a way to "see" where abnormal beats start and how they spread inside the heart using only sensors on the skin and computer models. If successful, such technology could make advanced care for dangerous arrhythmias more accessible, especially in hospitals that lack expensive scanners or invasive procedures.
Why Heart Rhythms Are So Hard to Track
Conditions like atrial fibrillation, ventricular tachycardia, and other rhythm problems affect roughly one in three adults and raise the risk of stroke, heart failure, and sudden death. Today, doctors often rely on drugs that may not work well or invasive procedures in which catheters are steered inside the heart to map electrical signals. A newer non-invasive approach, called electrocardiographic imaging, already uses many chest electrodes and computer models to turn body-surface signals into maps of electrical activity on the outer surface of the heart. But a key limitation remains: many dangerous rhythms start deeper in the heart wall, out of reach of surface-only maps, which can lead to uncertain localization and longer, more complex procedures.
From Flat Maps to 3D Heart Activity
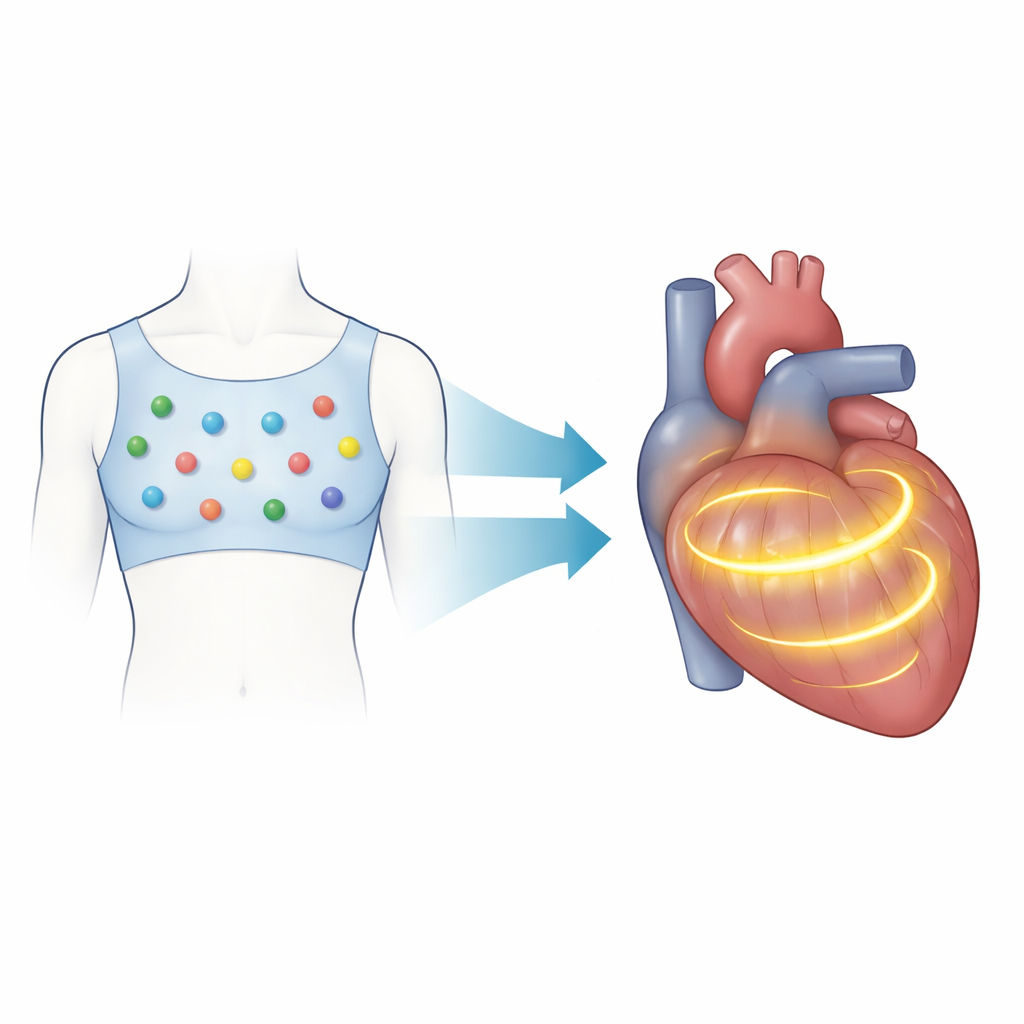
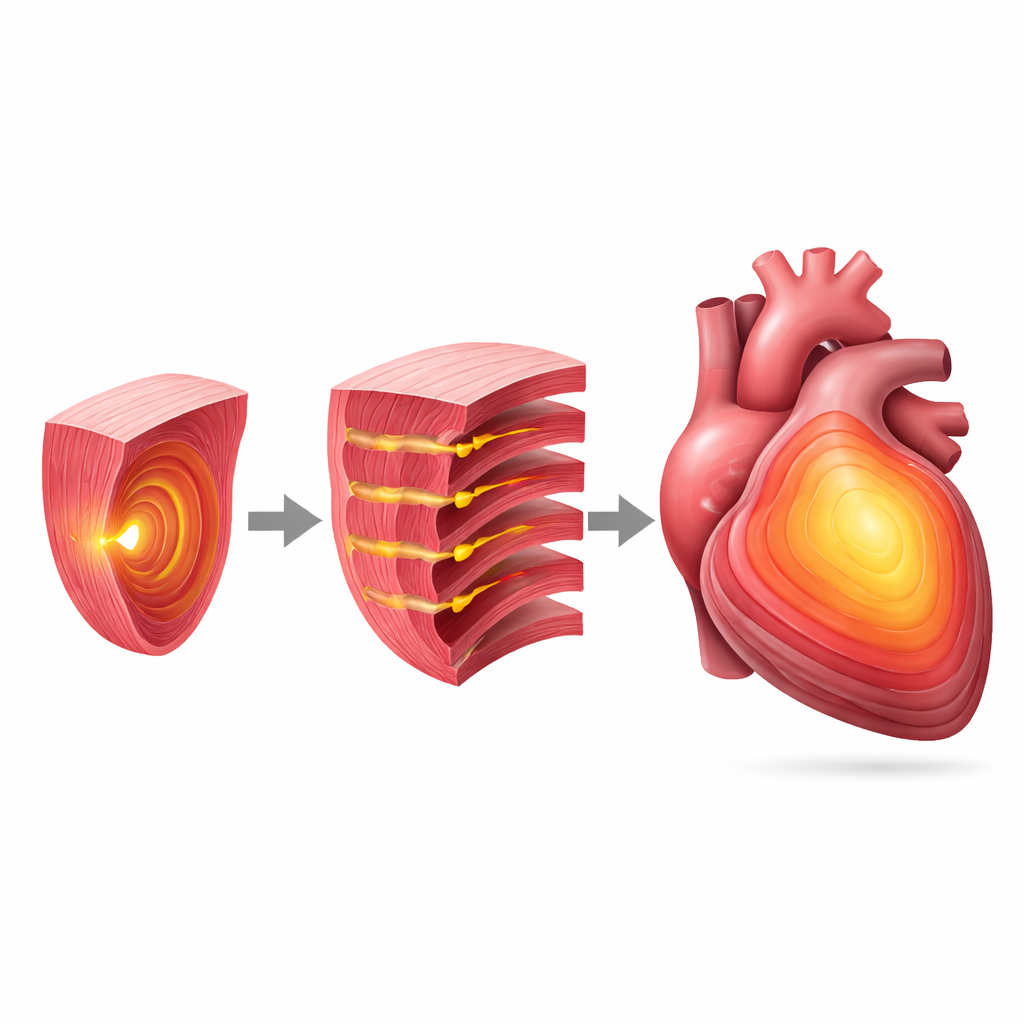
The authors introduce a volumetric version of this mapping approach that reconstructs electrical activity throughout the entire heart muscle instead of just its surface. Patients wear a vest with 128 electrodes that record subtle voltage changes on the torso. At the same time, the system builds an approximate 3D model of the patient’s torso and heart using camera-based scans and a statistical shape model, avoiding the need for CT or MRI. Using a physics-based formulation that treats the heart’s tiny electrical sources as a volume of currents, the method links body-surface signals to activity inside the heart. Mathematical tools called Green’s functions and regularization algorithms then estimate how an activation wavefront moves through the heart muscle over time, producing 3D "activation time" maps that show when each region of the heart turns on.
Testing the Method in Virtual and Real Hearts
To see how well this 3D mapping works, the team first created computer models of premature ventricular contractions—extra beats that start in different parts of the ventricles. They compared their volumetric maps with traditional surface-based maps, measuring how far each method’s estimated origin was from the true origin in the simulation. The volumetric approach cut the typical distance error roughly in half, with especially large improvements for beats beginning in complex regions such as the septum (the wall between the ventricles) and the ventricular base. The method was then applied to four patients with challenging rhythm problems: extra beats from the right ventricular outflow tract, left bundle branch block, a re-entrant ventricular tachycardia linked to scar tissue, and Wolff–Parkinson–White syndrome with an extra electrical pathway. In each case, the reconstructed 3D activation patterns agreed with invasive maps, imaging-based scar assessments, or standard electrocardiograms.
What 3D Maps Reveal in Specific Diseases
In the patient with extra beats from the right ventricular outflow tract, the non-invasive 3D map correctly identified the area where invasive catheters later ablated the problem. In the left bundle branch block case, the method showed delayed activation across the left ventricle, capturing the uneven timing that is important for choosing and tuning resynchronization therapy. For the ventricular tachycardia patient, the 3D map traced a looping activation path that matched a corridor of fibrotic tissue defined by specialized imaging software. In the Wolff–Parkinson–White patient, the volumetric approach mapped activation in both atria and ventricles at once, clarifying how the extra pathway connects them. The researchers also tested two publicly available cases of old heart attacks and could roughly match the location and extent of scar-related abnormalities, although one case remained challenging.
Promise and Next Steps for Patient Care
This work suggests that volumetric electrocardiographic imaging can provide a non-invasive, three-dimensional view of how electrical signals move through the heart muscle, not just across its surface. By improving the precision with which doctors can locate the sources and pathways of abnormal rhythms—especially those buried deep in the heart—the technique could sharpen pre-procedure planning, guide ablation more directly, and help decide who is likely to benefit from therapies like cardiac resynchronization. The authors emphasize that larger, carefully controlled clinical studies are still needed, but the approach points toward a future in which detailed, 3D maps of heart rhythm problems can be generated from a vest of electrodes and standard computer hardware, potentially broadening access to advanced arrhythmia care worldwide.
Citation: Vicente-Puig, J., Chamorro-Servent, J., Zacur, E. et al. Volumetric non-invasive cardiac mapping for accessible global arrhythmia characterization. Commun Med 6, 263 (2026). https://doi.org/10.1038/s43856-025-01332-5
Keywords: cardiac arrhythmia, noninvasive heart mapping, electrocardiographic imaging, 3D cardiac activation, catheter ablation planning