Clear Sky Science · en
High-resolution soybean tracing for deforestation-free supply chains
Why soybeans and forests are linked
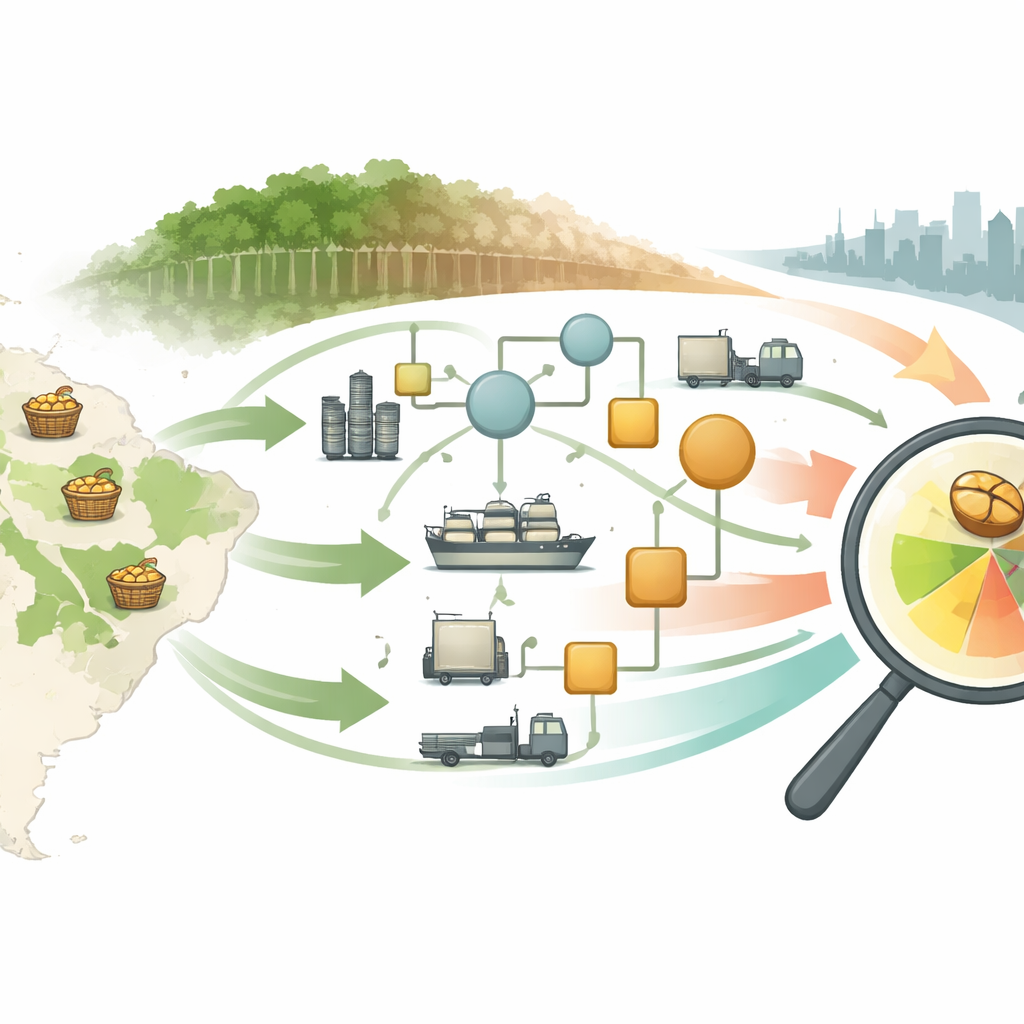
Soybeans may seem like a humble crop, but they quietly underpin much of the world’s meat, dairy and farmed fish production. As demand for this protein-rich bean has surged, vast areas of tropical forest have been cleared to grow it, especially in South America. Governments are now trying to stop food and feed linked to recent deforestation from entering their markets. That raises a thorny question: when a ship full of soybeans arrives at a port, how can anyone really know where those beans were grown?
The challenge of hidden supply chains
Modern soybean supply chains are sprawling and opaque. Beans from countless farms are mixed in trucks, silos and ships before being crushed into oil and meal and sent around the world. New rules, such as the European Union’s deforestation regulation, will soon require importers to prove that their soy does not come from land cleared after 2020. Companies must report the exact field coordinates and harvest dates, but paperwork can be falsified and trade incentives may encourage misreporting. Authorities are therefore looking for independent, science-based ways to check where a shipment really originated.
Reading the chemical fingerprint of a bean
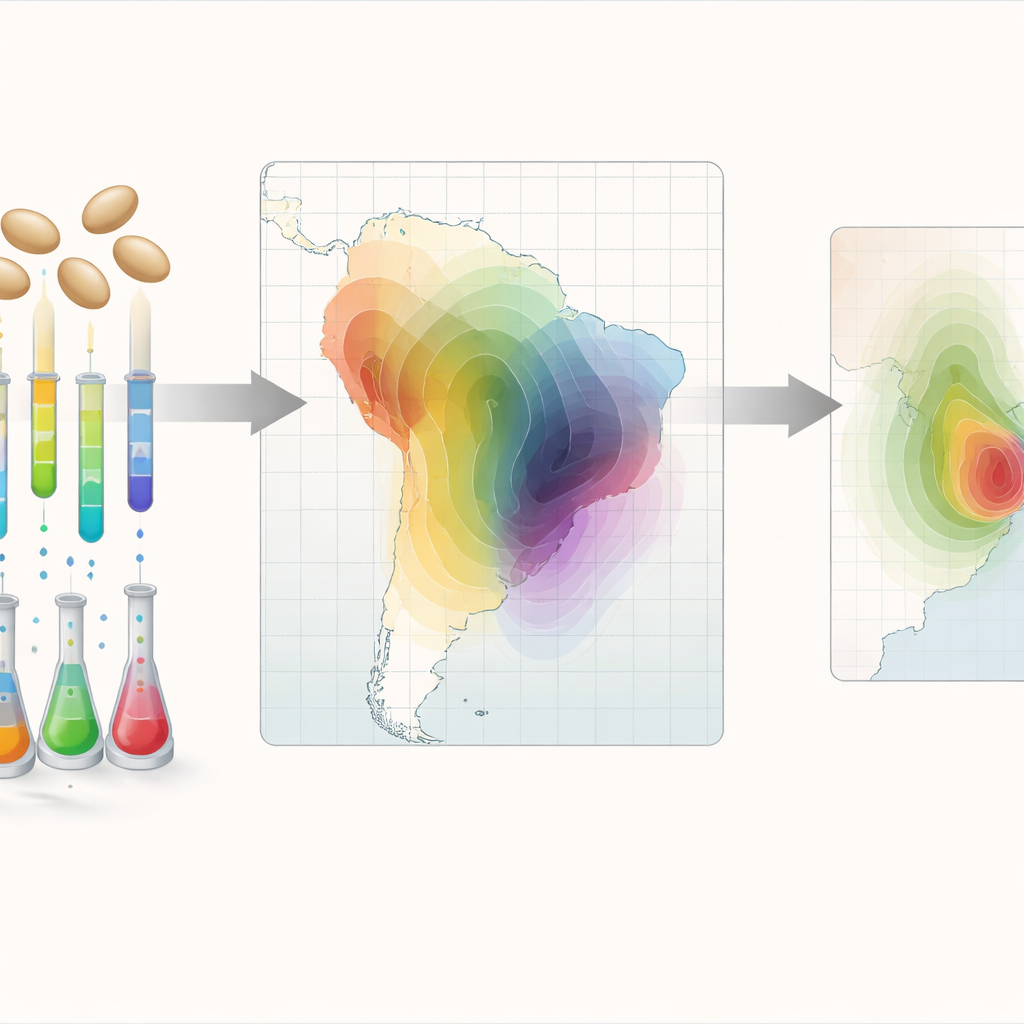
The authors of this study set out to use the beans themselves as proof of origin. Plants carry a subtle chemical fingerprint that reflects the climate and soil in which they grew. Ratios of stable isotopes—slightly heavier or lighter forms of elements like hydrogen, oxygen, carbon, nitrogen and sulfur—shift with rainfall patterns, temperature and other atmospheric factors. Trace amounts of metals and other elements in plant tissue echo the underlying geology and soils. By carefully measuring these signatures in 267 soybean samples collected across the main producing regions of Brazil, Argentina and Bolivia, the team built a reference map linking chemical patterns to geography.
From scattered samples to a continuous map
Most previous efforts to trace crop origin treated the problem like sorting items into boxes: a model chose among a small list of countries or regions. That approach breaks down when neighboring areas are similar, and it cannot say anything about locations between sampled sites. Instead, the researchers used a statistical method called a Gaussian Process, which treats the entire landscape as continuous. In practice, the model learns how chemical similarity declines with distance. It then estimates, for any new sample, how likely each point on the map is to be the true harvest location. This produces a probability surface rather than a single yes-or-no country label and allows the model to work even in areas that were not sampled directly, as long as they fall within the broader region.
Pinpointing origin and reducing uncertainty
The team compared three versions of their model: one using only isotopes, one using only trace elements, and one using both together. Combining the two data types gave by far the best performance. On average, the model’s most likely location lay about 190 kilometers from the true farm, and the area that contained 95% of the probability was only a few percent of the total soy-growing region considered. In practical terms, the method narrows a shipment’s plausible origin down to a relatively compact patch on the map. When they converted these continuous predictions into simple country choices, accuracy matched or exceeded that of earlier classification studies, even though their task—distinguishing nearby producing regions across national borders—was considerably harder.
What this means for forests and trade
For regulators and companies, this approach offers a powerful new way to check origin claims. Inspectors could analyze random samples from shipments and see whether their chemical fingerprints match the declared farms, or whether they are more likely to come from high-risk frontiers where illegal forest clearing is occurring. While the method is not perfect—many estimates still fall more than 200 kilometers from the exact field—it provides a transparent, quantitative measure of uncertainty expressed directly in distances and areas. Combined with satellite monitoring, farm registries and other tools, it can help make soybean supply chains far more accountable and support efforts to keep deforestation-linked products out of global markets.
Citation: Maor, R., Truszkowski, J., Ablett, F. et al. High-resolution soybean tracing for deforestation-free supply chains. Commun Earth Environ 7, 310 (2026). https://doi.org/10.1038/s43247-026-03380-8
Keywords: soybean traceability, deforestation, supply chains, stable isotopes, Gaussian process modeling