Clear Sky Science · en
Multimodal large language models, street view images and urban policy-intelligence: recovering the sustainability effects of redlining
Why city streets and old maps still matter today
Many cities are trying to cut poverty and protect people from heat, but they often lack up-to-date, block-by-block information on where help is needed most. This study shows how modern artificial intelligence can read ordinary street photos to reveal where low income and low tree cover still cluster together, especially in neighborhoods shaped by the historic practice of redlining in Phoenix, Arizona.
Old housing grades and today’s uneven streets
In the 1930s, federal housing maps labeled some neighborhoods as “hazardous” for home loans, a process known as redlining. These places, often with more residents of color and older housing, received fewer public and private investments for decades. In Phoenix, the hottest big city in the United States, that history still matters because areas with less money and fewer trees face more dangerous heat and worse living conditions. The authors focus on two simple pillars of neighborhood health: how many residents live in poverty and how much tree canopy offers shade.
Turning street photos into neighborhood report cards
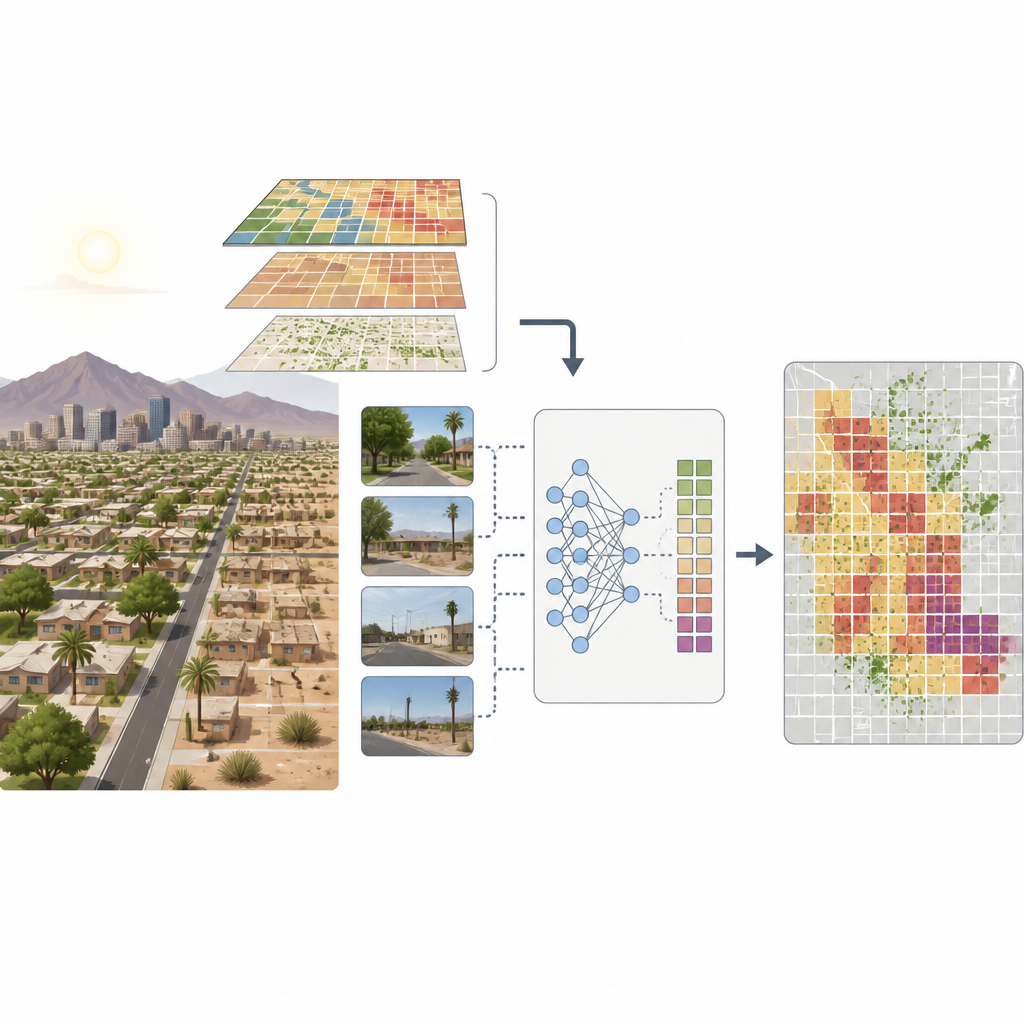
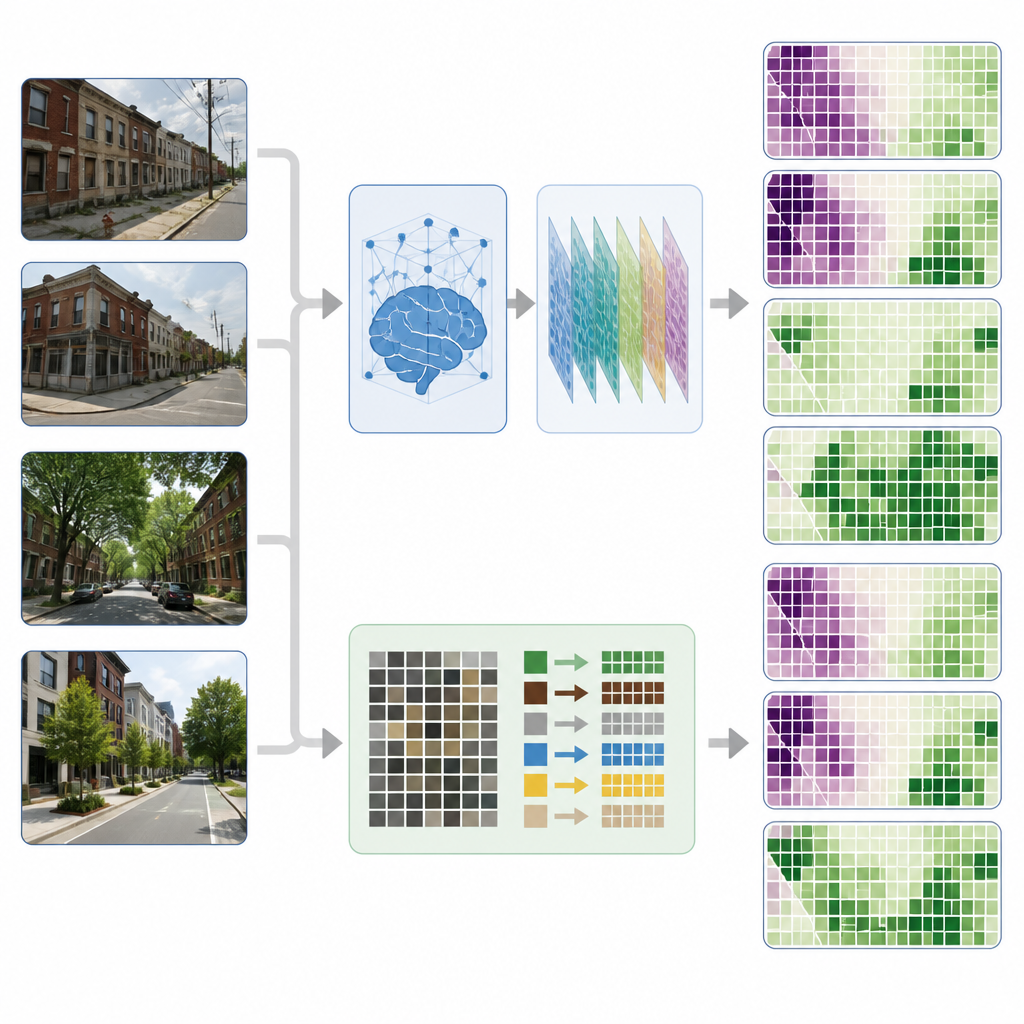
The researchers collected nearly twenty thousand Google Street View images across more than one thousand small neighborhoods. They then built two kinds of tools to “read” these pictures. One tool uses a multimodal large language model, GPT-4o, which looks at an entire scene and reasons in plain language about clues such as housing quality, visible upkeep, and greenery before converting that reasoning into numeric scores for poverty and tree cover. The other tool is a standard computer vision model that classifies individual pixels into categories like road, building, or tree and then counts how much of each is present. For each neighborhood, the team averaged results from many images and compared these AI-based measures to official data from the U.S. Census on poverty and from Google’s Environmental Insights Explorer on tree canopy.
Checking AI against official numbers and redlining’s legacy
The team then tested whether the AI estimates told the same story as the official statistics about the lingering effects of redlining. Using several kinds of statistical models that account for local traits, city service differences, and spillovers between nearby neighborhoods, they compared historically redlined areas to two reference groups: “ideal” areas with high incomes and “stable or declining” areas that were not marked as hazardous. Across almost all model versions, both AI approaches reproduced a familiar pattern: redlined neighborhoods still have higher poverty and lower tree cover than comparison areas. Crucially, GPT-4o’s estimates of these gaps were nearly identical to the official data, while the pixel-counting model tended to understate how strongly poverty is tied to redlining.
Why holistic street understanding works better
To understand why, the authors examined how well each method explained variation in the official poverty and canopy numbers. GPT-4o alone captured about as much of the poverty pattern as a rich set of demographic and education statistics, and much more than the segmentation model. Its advantage was especially strong in the most disadvantaged or most tree-rich neighborhoods, where policy questions are often most urgent. This suggests that poverty leaves a mark not only in isolated objects, such as the number of trees, but also in broader cues like maintenance, building form, and infrastructure neglect. GPT-4o’s ability to consider the whole scene allows it to pick up on those subtle signals that simple pixel counts may miss, while still performing well for tree coverage, where counting canopy matters most.
New tools for fairer, greener cities
The study concludes that carefully designed prompts for a multimodal large language model can turn common street imagery into timely, neighborhood-scale indicators of poverty and tree shade that agree closely with trusted sources. Because this approach does not require training a new model for each city and can be run by non-specialists with proper checks, it offers a practical way for planners, agencies, and community groups to map where social and environmental gaps line up, track whether local programs are working, and retarget resources as needs change, all while keeping humans in the loop for oversight.
Citation: Howell, A., Wu, N., Bagchi-Sen, S. et al. Multimodal large language models, street view images and urban policy-intelligence: recovering the sustainability effects of redlining. npj Urban Sustain 6, 79 (2026). https://doi.org/10.1038/s42949-026-00380-7
Keywords: urban sustainability, redlining, street view imagery, multimodal AI, tree canopy