Clear Sky Science · en
Causal modeling of energy and resource demand
Why Our Use of Power and Water Matters
From the lights in our homes to the water in our taps and the cars we drive, modern life runs on energy and resources. Yet our collective demand has grown so large that it is reshaping the planet and straining the limits of what Earth can provide. This article explores a new way to understand that demand: instead of just spotting patterns in data, it looks for what actually causes people and buildings to use more or less energy and water. By tracing cause-and-effect, the authors aim to help cities design smarter policies that truly curb waste rather than chase misleading trends.
Looking Beyond Simple Correlations
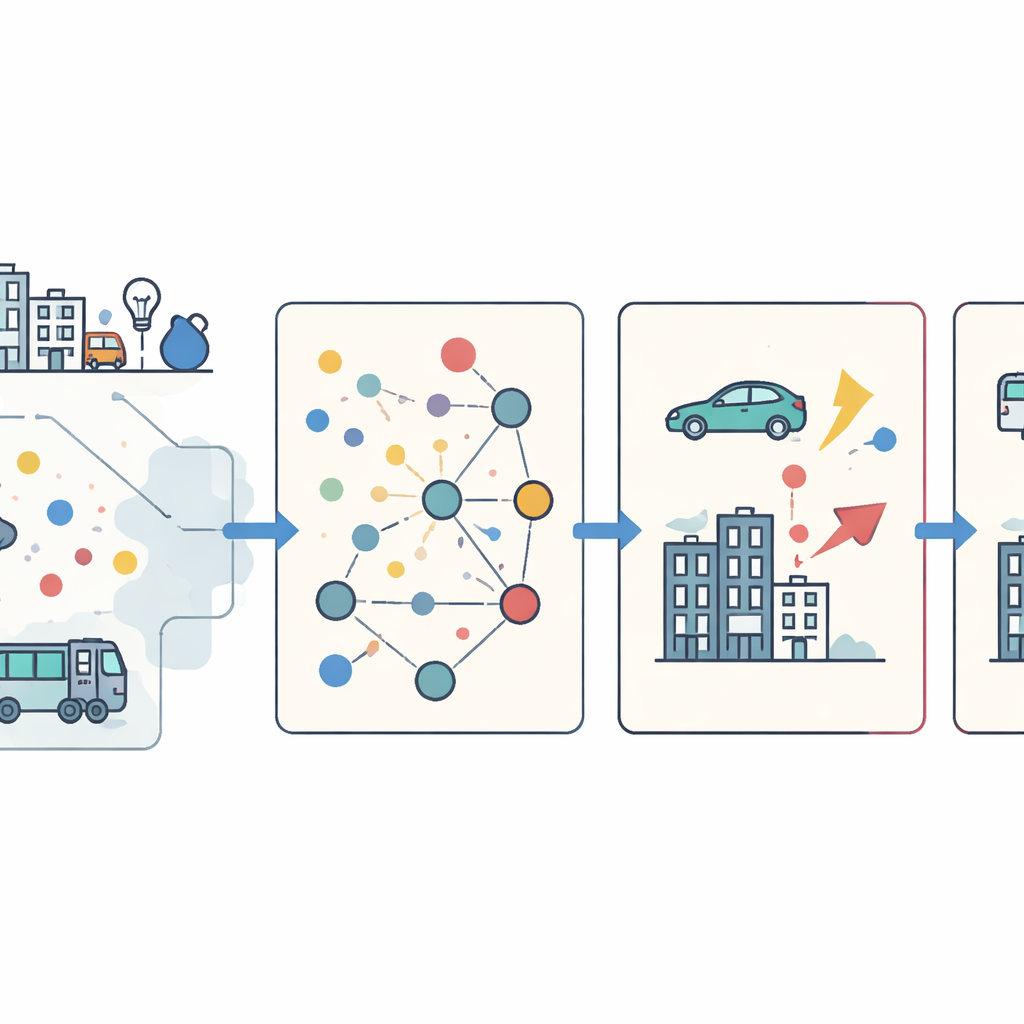
Most existing tools for studying electricity use, water consumption, or travel choices rely on correlation: they find variables that move together, such as larger homes and higher power bills. But correlation alone cannot answer a crucial question: if we change one factor, will it really change the outcome? The emerging “science of causality” tries to answer that question directly. It represents systems as networks of arrows that trace how one factor leads to another, allowing researchers to ask precise “what if” questions—such as what happens to car use if household income or trip distance changes. This shift from association to causation is especially important when the goal is to design effective policies rather than just make accurate forecasts.
Three Everyday Ways We Use Resources
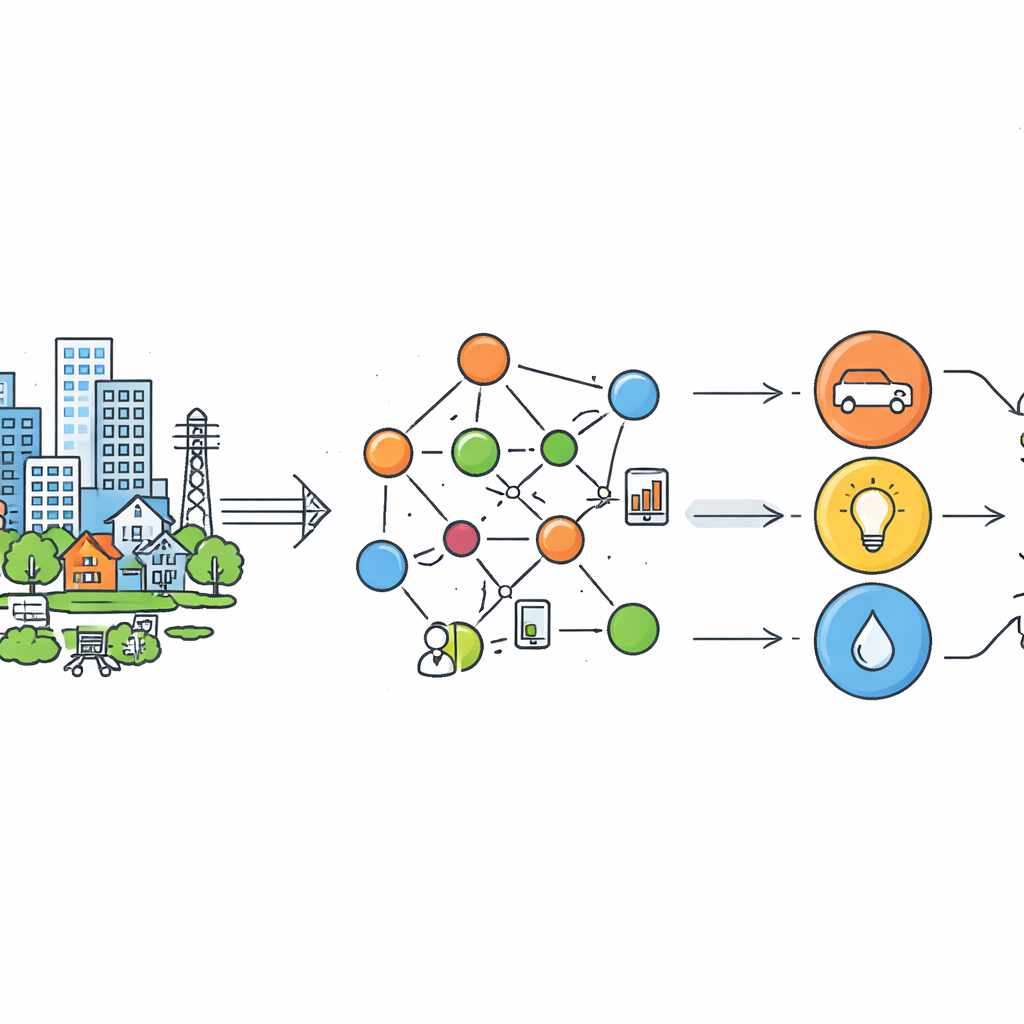
To show how causal methods work in practice, the authors analyze three familiar forms of urban demand: how people choose between car, public transit, and walking; how much electricity large buildings use; and how much water those same buildings consume. Using standard, publicly available datasets for Chicago (travel behavior) and New York City (building utilities), they apply a computer algorithm to uncover likely cause-and-effect links among social, economic, and physical factors. A second method then estimates how strongly each cause changes the outcome on average across the population. Together, these tools reveal not just which variables are connected, but which ones appear to drive behavior.
What the Causal Maps Reveal
For travel choices, the resulting causal map is intricate. It points to the number of vehicles in a household and the distance of a trip as direct causes of choosing to drive, ride transit, or walk. It also suggests chains of influence running through age, education, employment, income, and race, reflecting deeper social structures. In contrast, the causal diagrams for electricity and water use in large buildings are surprisingly simple: building type (residential versus non-residential) and building age emerge as the main drivers of electricity, while building type alone stands out for water use. The authors argue that the simplicity likely reflects limits in the available data—many real-world influences, such as building operations or neighborhood features, were not fully captured—yet even this pared-down picture highlights which levers matter most in the studied context.
Promises, Pitfalls, and Policy Choices
The article openly discusses the strengths and weaknesses of these causal tools. On the plus side, causal models can filter out misleading correlations, expose hidden chains of influence among variables, and show what might happen if a city intervenes—for instance, by changing building standards or improving transit service. On the downside, the methods depend on their underlying assumptions, the richness and quality of the data, and guidance from experts who know which links are plausible and which are not. Some relationships—such as those involving race or gender—may act as stand-ins for broader social inequalities and must be interpreted carefully. Moreover, the findings are tied to the particular cities and datasets studied and may not apply everywhere.
What This Means for a Sustainable Future
In accessible terms, the main conclusion is that if we want to reduce society’s appetite for energy and water, we must understand not just what goes together, but what truly causes what. Causal modeling is still a young field, and the specific techniques used here have clear limitations, yet the study shows that they can already shed light on which factors genuinely drive demand and which ones are red herrings. By mapping out these cause-and-effect pathways, city planners and policymakers can focus on interventions that are more likely to work—such as targeting particular building types or travel conditions—while avoiding costly measures based on misleading patterns. In short, this approach offers a more reliable roadmap for bringing our everyday use of power and water back within the planet’s limits.
Citation: Chauhan, R.S., Acosta, J. & Derrible, S. Causal modeling of energy and resource demand. npj Urban Sustain 6, 67 (2026). https://doi.org/10.1038/s42949-026-00370-9
Keywords: causal modeling, urban energy demand, water and electricity use, travel behavior, sustainability policy