Clear Sky Science · en
HarveST uses a heterogeneous graph learning framework to reveal spatial transcriptomics patterns
Seeing Where Genes Act Inside Tissues
Our bodies are built from neighborhoods of cells that each do different jobs, from thinking in the brain to fighting tumors in cancer. A growing technology called spatial transcriptomics lets scientists map which genes are active in different spots across a tissue slice. But turning these raw maps into clear, meaningful regions and lists of important genes is still difficult. This study introduces a new computer method, HarveST, that helps researchers see tissue structure and its key genes more clearly, even in complex organs and tumors.
Why Mapping Cell Neighborhoods Is Hard
In tissues, nearby cells often work together as functional communities, such as layers in the brain or zones around a tumor. Spatial transcriptomics measures gene activity at thousands of small spots across a tissue, along with their exact locations. Existing computer tools try to group these spots into spatial domains, regions that share both similar gene activity and physical proximity. Many methods either ignore spatial location or assume that neighboring spots must belong to the same region. This can blur important boundaries, miss rare cell pockets, and fail to link each region to the genes that actually define it.
A New Way to Connect Space and Genes
HarveST tackles these problems by turning each dataset into a rich network that links tissue spots and genes at the same time 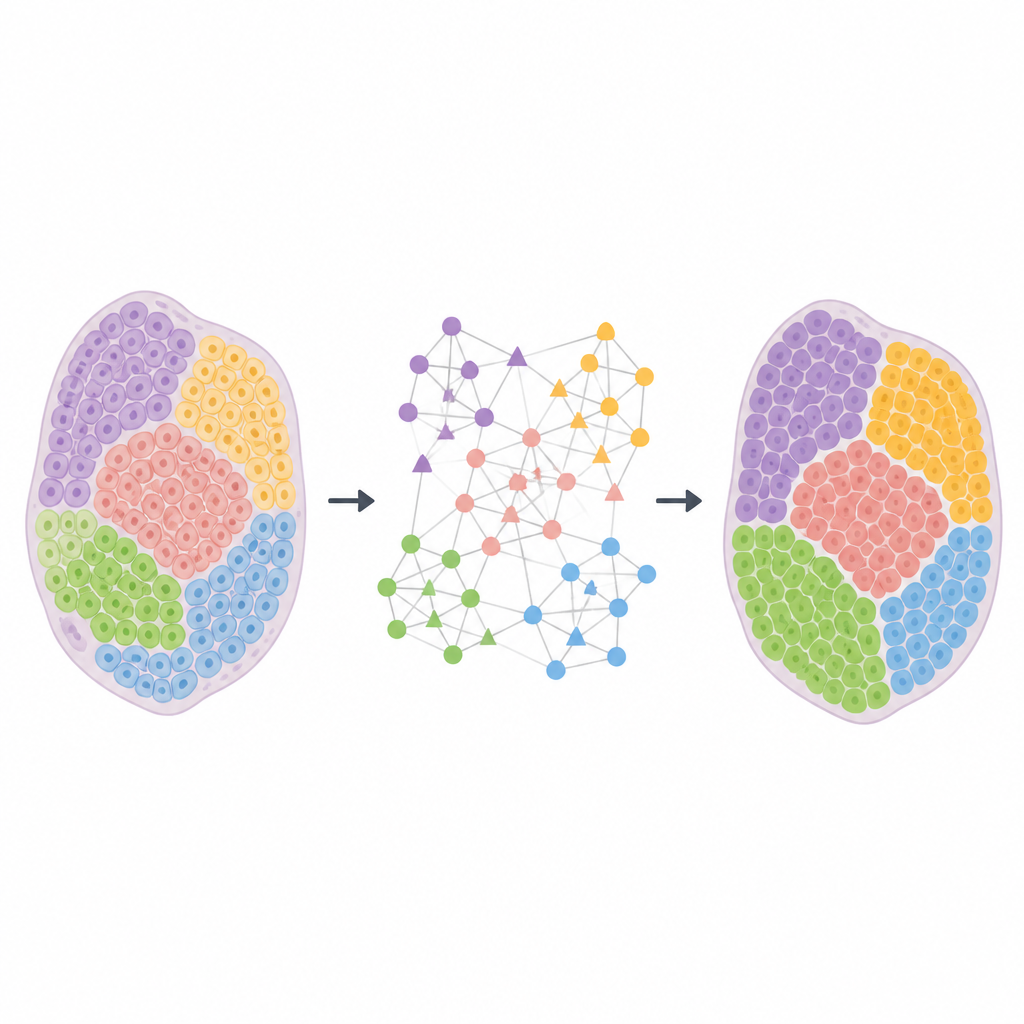
Finding the Right Genes for Each Region
Beyond drawing maps of tissue regions, HarveST aims to find the marker genes that make each region unique. Instead of testing each gene in isolation, the method sends out a “random walk” from spots inside a chosen region and lets this signal spread through the network 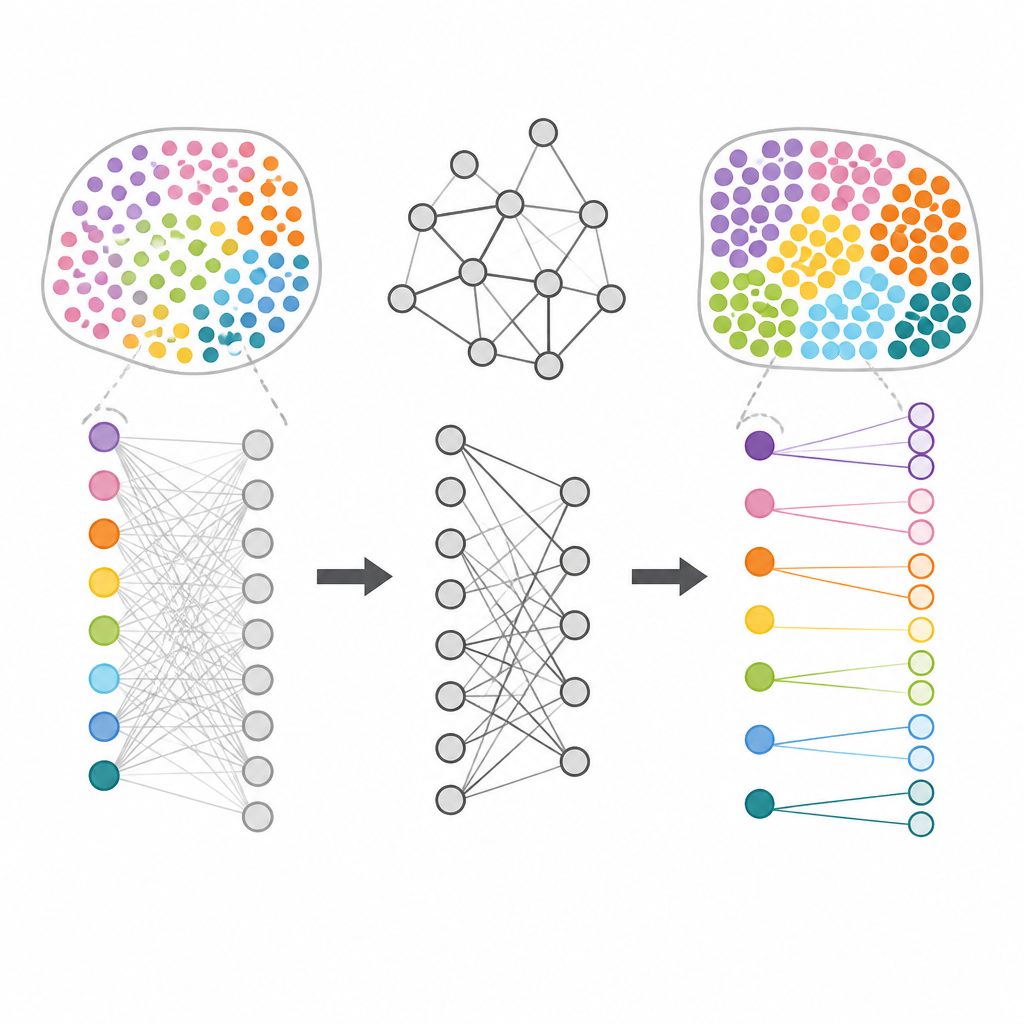
What HarveST Reveals in Brains and Tumors
To test HarveST, the team applied it to human brain, breast cancer, pancreatic cancer, and mouse olfactory bulb samples measured on several spatial transcriptomics platforms. In human prefrontal cortex, HarveST more accurately recovered the classic six cortical layers and white matter than fourteen competing methods, scoring higher on a broad set of clustering and boundary metrics. In high-resolution mouse olfactory bulb data, it stood out by separating thin, closely packed layers that other tools blended together. In breast and pancreatic cancers, HarveST better distinguished tumor edges, normal regions, and invasive cancer zones, and linked them to genes already known to mark malignancy, immune involvement, and tissue remodeling, as well as highlighting additional, plausible candidates.
Consistent Maps Across Tissue Slices
Real tissues are three-dimensional, but spatial transcriptomics typically measures thin two-dimensional slices. HarveST can jointly analyze several consecutive slices by building a shared network that respects each slice’s internal layout while also connecting similar regions across slices. In paired human brain sections, this joint analysis improved alignment between slices and produced continuous cortical layers that extended smoothly from one section to the next. This suggests HarveST can help reconstruct more faithful three-dimensional views of tissue architecture from standard experiments.
What This Means for Future Biomedical Research
In summary, HarveST offers a unified way to go from raw spatial gene maps to clear tissue regions and their key genes, while respecting both spatial structure and molecular relationships. For non-specialists, this means scientists gain sharper “weather maps” of gene activity inside organs and tumors, and more trustworthy gene lists that explain why one region differs from another. As spatial technologies advance, approaches like HarveST may become central tools for understanding how healthy tissues are organized, how diseases like cancer reshape that organization, and where new diagnostic markers or treatment targets might be found.
Citation: Feng, J., Yu, T. & Zhang, Y. HarveST uses a heterogeneous graph learning framework to reveal spatial transcriptomics patterns. Commun Biol 9, 681 (2026). https://doi.org/10.1038/s42003-026-09841-2
Keywords: spatial transcriptomics, tissue architecture, graph learning, cancer microenvironment, marker genes