Clear Sky Science · en
A signature-agnostic test for differences between tumor mutation spectra reveals carcinogen and ancestry effects
Why tiny DNA changes matter for cancer
Cancers grow because their DNA has been damaged in many small ways, leaving behind distinctive patterns of mutations. These patterns can hint at what caused the cancer, such as tobacco smoke, UV light, or inherited risk factors. But until now, researchers have lacked a simple, rigorous way to ask a basic question: do two groups of tumors – for example, from people with different ancestries or from animals exposed to different chemicals – truly have different mutation patterns, or are the apparent differences just noise? This paper introduces a general-purpose statistical tool to answer that question and shows that it can reveal hidden effects of carcinogens and ancestry on cancer genomes.
A new yardstick for comparing mutation patterns
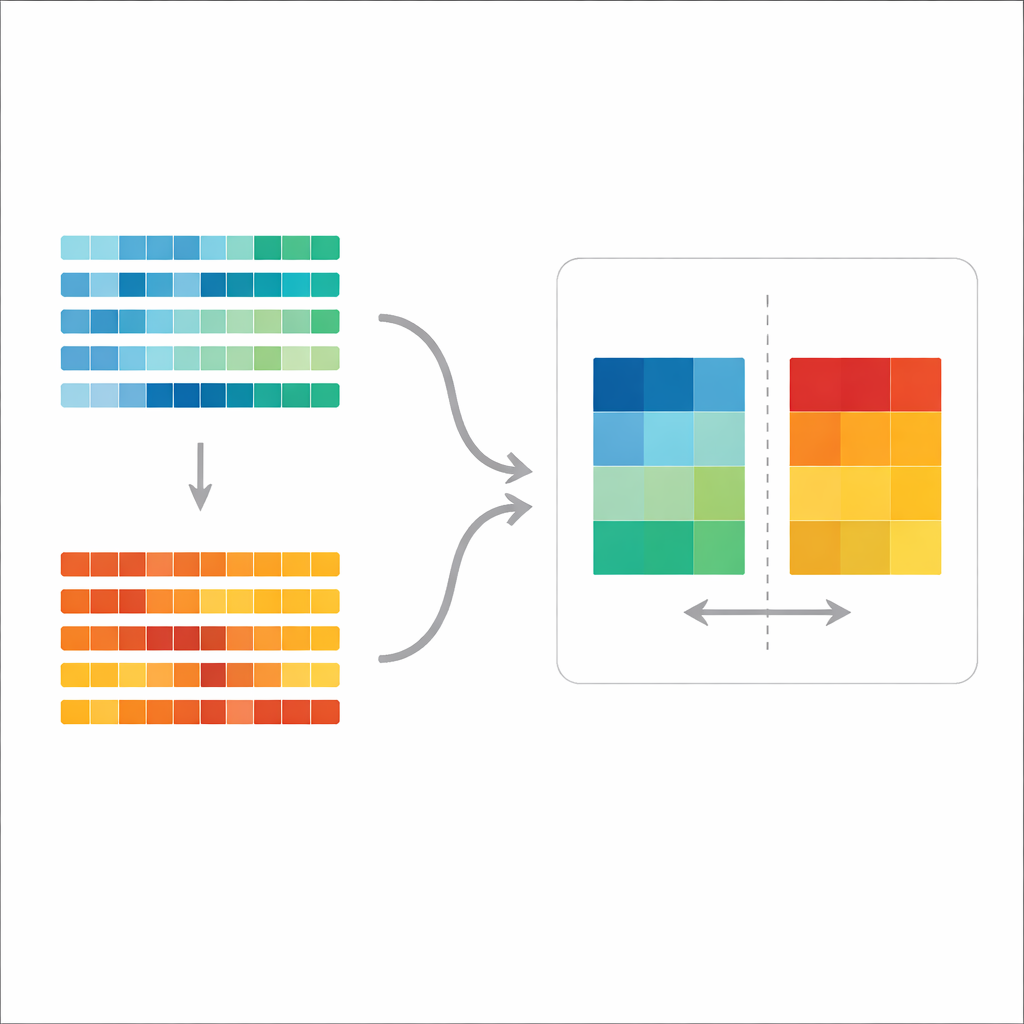
The authors build on the idea of a “mutation spectrum,” the overall mix of mutation types across a tumor’s genome. Existing work often breaks these spectra into predefined “signatures” thought to represent specific biological processes, then inspects which signatures appear in which tumors. That approach is useful for storytelling but not ideal for formal testing: it can be hard to tell whether two groups truly differ once you account for natural variation within each group and the uncertainty in assigning signatures. The new method, called the aggregate mutation spectrum distance (AMSD), sidesteps this by working directly on the raw spectra and asking, in a statistically controlled way, whether two groups’ average spectra are more different than expected by chance.
How the AMSD test works under the hood
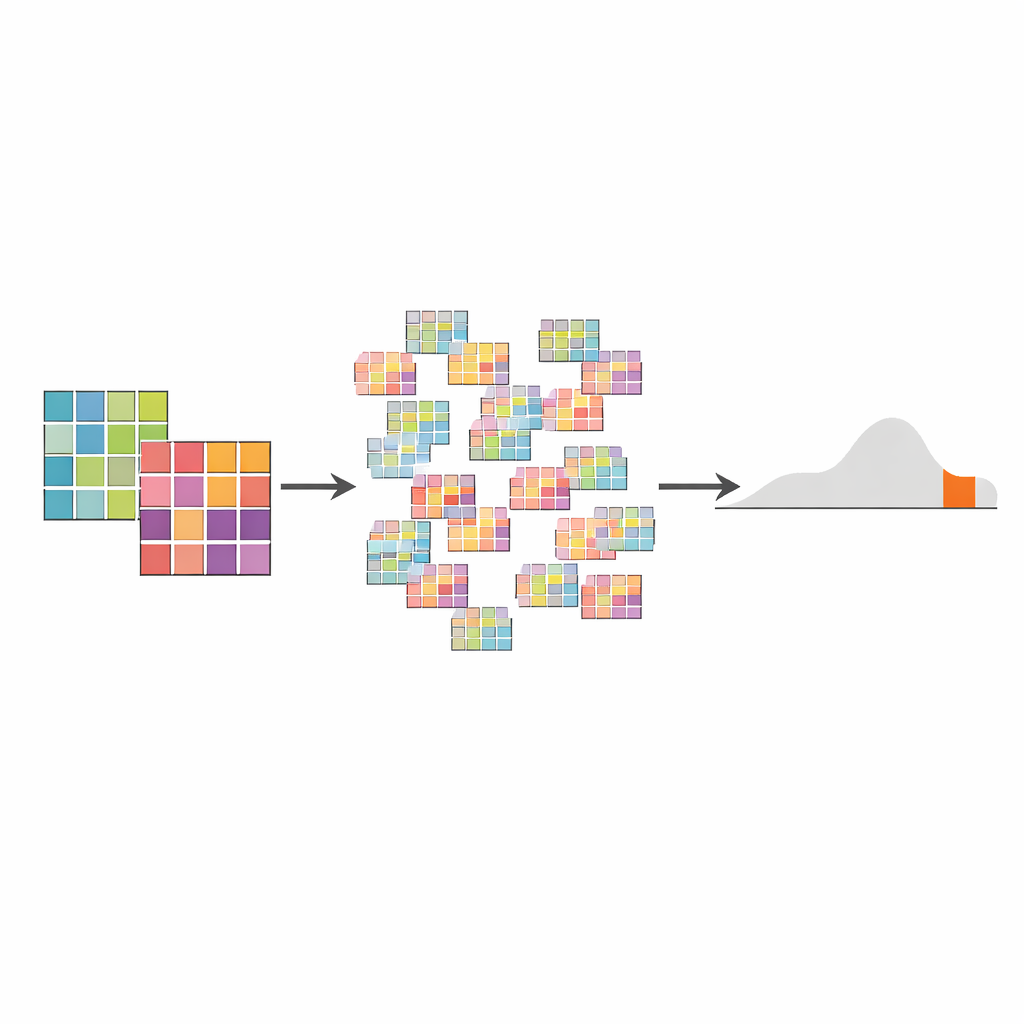
AMSD first combines the mutation data from all tumors in each group into one “aggregate” spectrum per group, either giving each tumor equal weight or weighting them by how many mutations they carry. It then measures how far apart these two spectra are using a distance measure such as cosine distance, which captures how different their shapes are. To decide if that observed distance is meaningful, the method uses a permutation test: it repeatedly shuffles which tumors belong to which group, recomputes the distance thousands of times, and builds up a “null” distribution of distances expected if there were no real group difference. The p-value is simply the fraction of shuffled comparisons that look at least as extreme as the real one. This framework naturally handles uneven sample sizes and mutation counts, and its null distribution can even hint at hidden subtypes or outliers in the data.
Hidden effects of cancer-causing chemicals in mice
To show what AMSD can do, the team reanalyzed a study in which mice were exposed to 20 different suspected carcinogens, and tumors from these animals were compared with tumors from unexposed control mice. The original study had only reported three chemicals that produced unmistakable new mutation signatures. Using AMSD, the authors found that 11 of 20 carcinogens produced statistically significant shifts in the overall mutation spectrum, even when the classic signature analysis had not flagged them. Some chemicals, like 1,2,3-trichloropropane, did create large, easily recognized changes. Others, such as the tranquilizer oxazepam, produced subtler but consistent shifts in certain mutation types that were invisible when looking only at standard signatures. These results suggest that many carcinogens may not introduce brand-new damage types but instead tweak the balance of the body’s existing mutation processes, for example by altering DNA repair or cell growth.
Mutation patterns and human ancestry
The authors then turned to a large human tumor collection from The Cancer Genome Atlas, focusing on cancers where there were enough tumors from people of African, East Asian, and European genetic ancestry. Using AMSD, they compared mutation spectra between ancestry groups within each cancer type. They uncovered significant differences in 16 of 67 tested comparisons after correcting for multiple testing, with six remaining highly robust. Some patterns echoed prior findings, such as higher exposure to a smoking-related mutation pattern in lung cancers from patients of African ancestry, even though these patients reported smoking fewer cigarettes than European-ancestry patients. Other results were new, including a marked difference in a pair of mutation patterns (SBS17a/b) between East Asian and European patients with esophageal cancer, and higher levels of certain polymerase-related mutation patterns in East Asian patients with uterine and colorectal cancers. The study emphasizes that these ancestry associations may reflect environmental, medical, or social differences as much as genetic ones, but they reveal real differences in how tumors accumulate mutations.
Why this tool changes the picture
Together, these analyses show that AMSD is a sensitive and broadly applicable way to detect when and where mutation patterns diverge – whether due to chemical exposure, ancestry, or other factors. It does not replace traditional signature analysis; instead, it complements it by first asking the clean question “do these groups differ at all?” and then using signatures to help explain why. By working directly on raw mutation spectra and minimizing the number of separate tests, AMSD can uncover subtle but consistent shifts that might otherwise be dismissed as noise. As cancer datasets grow larger and more diverse, this simple permutation-based yardstick is poised to help researchers map how environment, genetics, and chance combine to shape the DNA scars left behind in tumors.
Citation: Hart, S.F.M., Alcala, N., Feder, A.F. et al. A signature-agnostic test for differences between tumor mutation spectra reveals carcinogen and ancestry effects. Commun Biol 9, 462 (2026). https://doi.org/10.1038/s42003-026-09652-5
Keywords: cancer mutational spectra, carcinogen exposure, genetic ancestry, permutation testing, mutational signatures