Clear Sky Science · en
xGNN4MI: explainability of graph neural networks in 12-lead electrocardiography for cardiovascular disease classification
Why this matters for heart health
Heart attacks and other heart diseases remain leading causes of death worldwide, and the standard test for spotting trouble is the familiar squiggly line of the electrocardiogram, or ECG. Doctors are increasingly turning to artificial intelligence to help read these signals, but many AI tools behave like opaque black boxes, offering a verdict without showing their work. This study introduces a new approach called xGNN4MI that aims to keep the power of modern AI while making its reasoning visible and checkable for clinicians.
From heartbeats to connected signals
An ECG does not come from a single viewpoint: twelve different leads placed on the chest and limbs provide slightly different perspectives on the heart’s electrical activity. Each one is sensitive to a different region of the heart muscle and blood supply. The authors turn this multi-lead recording into a network, where each node represents one lead and connections capture how these signals relate to each other over time. By slicing the ten-second ECG into shorter patches and linking the same lead across patches, they build a structure that reflects both where the electrodes sit on the body and how the heartbeat unfolds beat by beat. This network becomes the input to a graph neural network, a type of AI that is designed to work on webs of connected data instead of simple grids or lists. 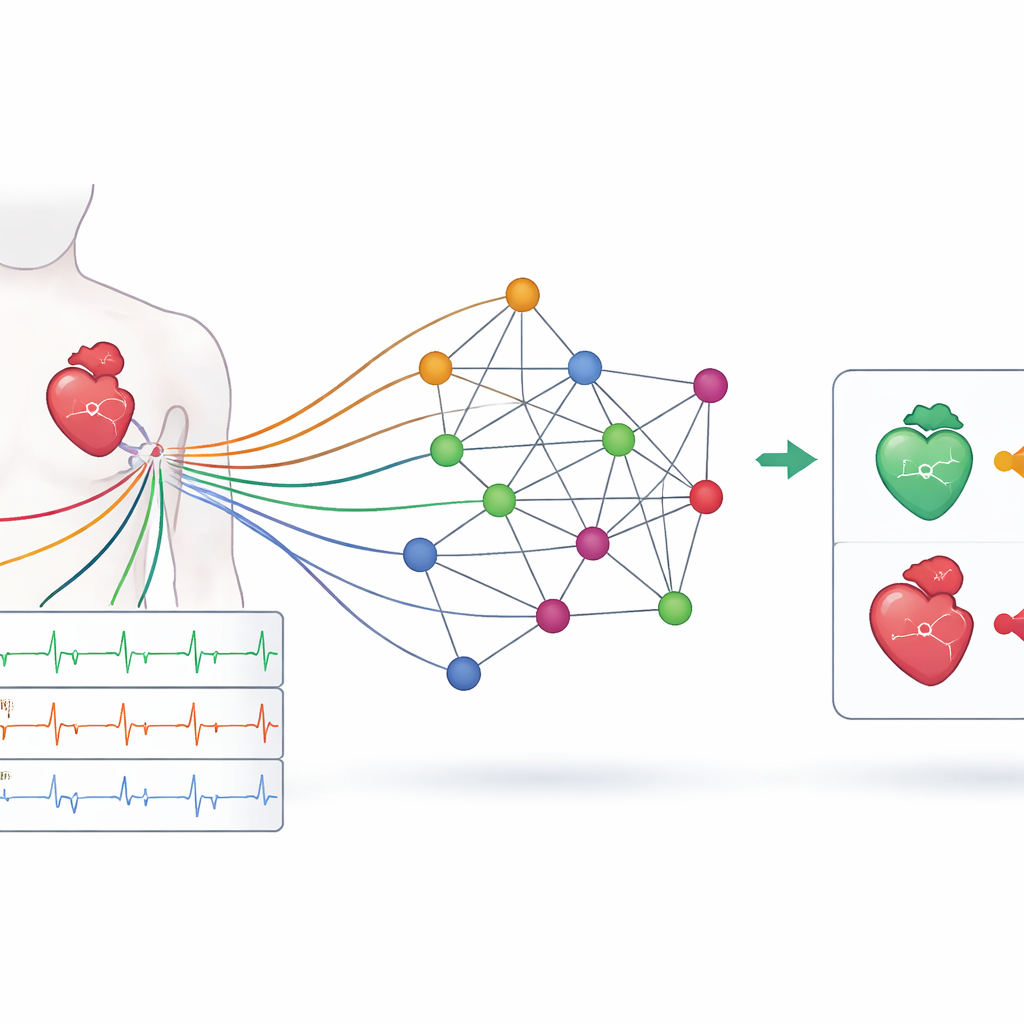
A new pipeline for reading and locating heart attacks
Using this network view of the ECG, the team designed an open-source pipeline they call xGNN4MI. It handles the full journey from raw signal to diagnosis: constructing the ECG graph, training the graph neural network, and then explaining how the model makes its predictions. They tested the system on two demanding tasks. First, it had to sort ECGs into five broad diagnostic groups, such as normal rhythm, heart attack, or rhythm conduction problems. Second, it had to go a step further and identify where in the heart a heart attack had occurred, distinguishing between damage in the front wall (anteroseptal) and the lower wall (inferior) of the heart muscle. The model was trained on a large public ECG collection and then challenged with a separate population-based study to see how well it generalized to new patients.
How well the system performs
On the broad grouping task, the model reached an accuracy of about seven out of ten ECGs, with especially strong performance in recognizing normal recordings and clear-cut heart attacks. Some categories that are more varied in appearance, such as heart muscle thickening or conduction disturbances, were harder to separate cleanly, likely because they cover several different underlying problems. For the more detailed task of pinpointing heart attack location, performance improved: the system correctly distinguished between major heart attack subtypes with a weighted F1-score near 0.8 on the main dataset and showed good ability to generalize to the external cohort. It was particularly reliable at recognizing classic inferior and anteroseptal patterns. However, it struggled more with identifying truly healthy hearts in the external study, a sign that subtle differences between datasets—such as slightly longer QRS durations, a measure of how long each heartbeat takes to activate—can trip up even well-trained models. 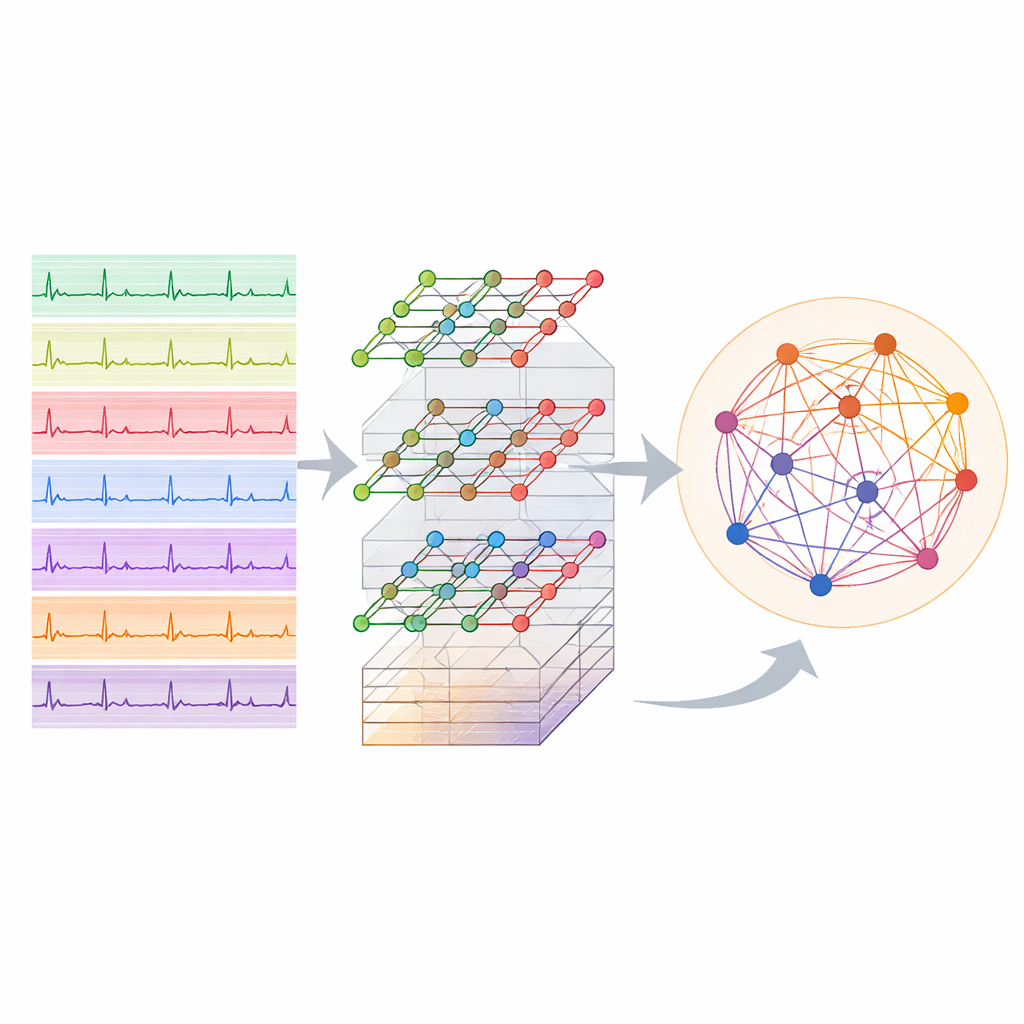
Seeing what the AI "looks at"
A central promise of xGNN4MI is that it does not just give an answer, but also shows which parts of the ECG graph mattered most. The authors used a method called GNNExplainer to highlight the most influential leads and connections for each prediction. When the model labeled an ECG as an anteroseptal heart attack, the most important nodes were the chest leads V1 to V3, matching textbook teaching that these leads watch the front wall of the heart. For inferior heart attacks, the model focused on leads II, III, and aVF, again mirroring traditional criteria. Interestingly, one limb lead (aVR), often overlooked in routine reading, emerged as unusually important in some inferior cases, echoing newer clinical reports that link changes in this lead to more severe complications. Normal ECGs, in contrast, showed a more even spread of importance across leads, consistent with the absence of a single damaged region.
Limitations and future directions
While the explanations lined up well with established cardiology knowledge, they also underscored current limits. The explainability method tends to focus on clusters of connected leads and does not fully capture distant relationships or fine-grained timing, even though these may be clinically relevant. The model also works with single dominant labels and does not yet reflect the mix of conditions often present in real patients. The authors suggest that future work could use more advanced explanation tools that better handle time, incorporate multi-label diagnoses, and tailor the graph structure to specific heart diseases. Nevertheless, by openly sharing code, documenting every design choice, and showing that their model focuses on clinically sensible regions of the ECG, xGNN4MI offers a concrete step toward AI tools that doctors can both use and trust.
What this means for patients and clinicians
In plain terms, this work shows that it is possible to build an AI assistant for ECG interpretation that not only spots heart attacks and suggests where they occurred, but also points to the same leads human experts rely on. Although it is not yet ready to replace a cardiologist, the framework demonstrates that powerful graph-based AI can be made more transparent and checked against medical knowledge. If further refined and validated, such tools could help less experienced clinicians in busy or resource-limited settings, flagging high-risk heart attacks quickly while providing a visual trail of how the decision was made.
Citation: Maurer, M.C., Hempel, P., Steinhaus, K.E. et al. xGNN4MI: explainability of graph neural networks in 12-lead electrocardiography for cardiovascular disease classification. npj Digit. Med. 9, 256 (2026). https://doi.org/10.1038/s41746-026-02367-1
Keywords: electrocardiogram AI, graph neural networks, myocardial infarction, explainable artificial intelligence, cardiovascular diagnosis