Clear Sky Science · en
Synthetic capillary pressure modeling with dipole sonic waves for enhanced reservoir characterization
Why rock pores matter for energy and water
Deep underground, oil, gas, and water move through tiny spaces between grains of rock. The size and shape of these pores control how easily fluids can be stored and produced, and they are captured in “capillary pressure curves” that engineers rely on for planning wells and managing reservoirs. Yet measuring these curves usually requires expensive, slow laboratory tests on rare core samples. This paper introduces a way to build those capillary curves synthetically, using only sound waves recorded in wells and a mathematically realistic picture of the rock’s pore network.
Listening to rocks instead of cutting them
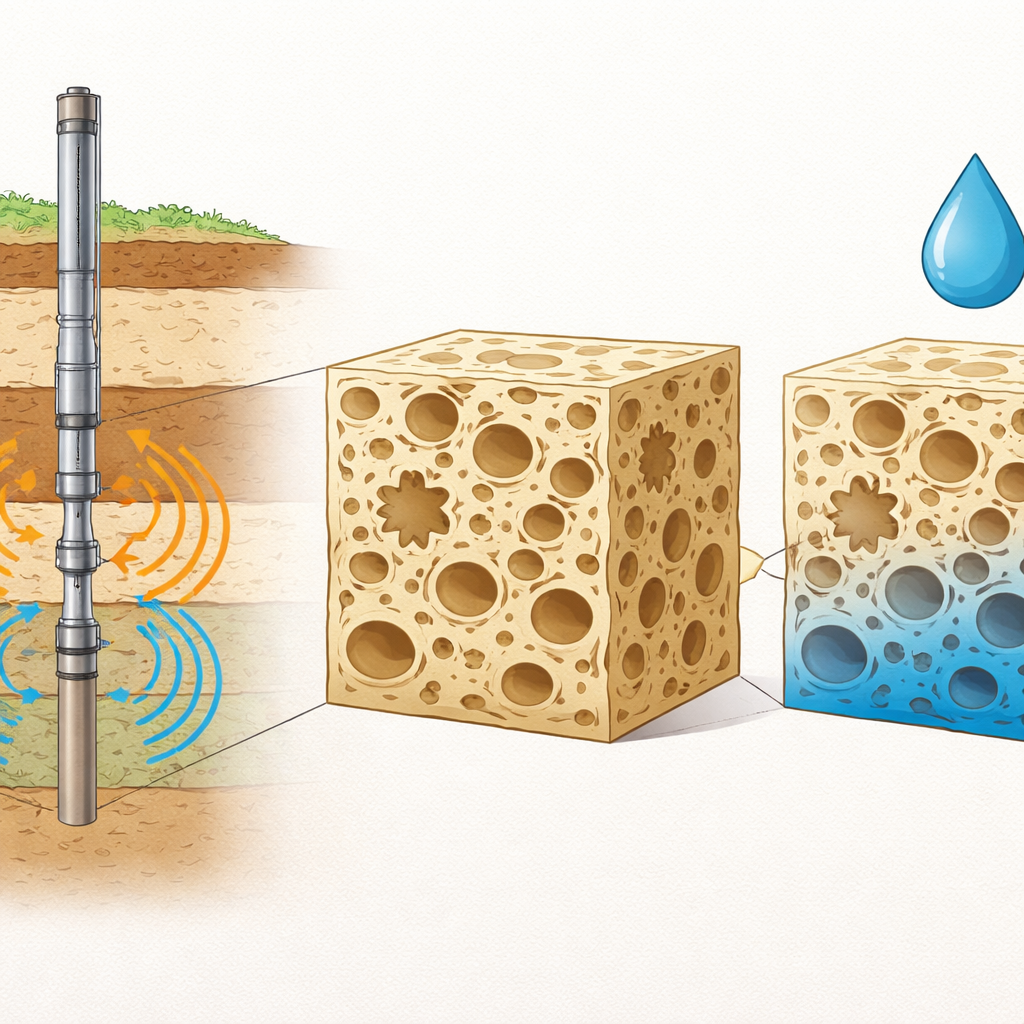
Conventional reservoir studies depend heavily on cores: cylinders of rock cut from the subsurface and tested with methods such as mercury injection or centrifugation. These tests reveal how fluids enter and leave pores at different pressures, but they demand pristine samples, specialized equipment, and significant time and cost. In many fields, few or no cores are available, leaving key questions about porosity, permeability, and fluid distribution unanswered. By contrast, well logs—especially dipole sonic logs—are routinely recorded along the entire length of a borehole. These tools send compressional (P) and shear (S) waves into the formation and record how fast they travel, providing a rich but indirect window into the rock’s stiffness and internal structure.
Building a realistic picture of pore networks
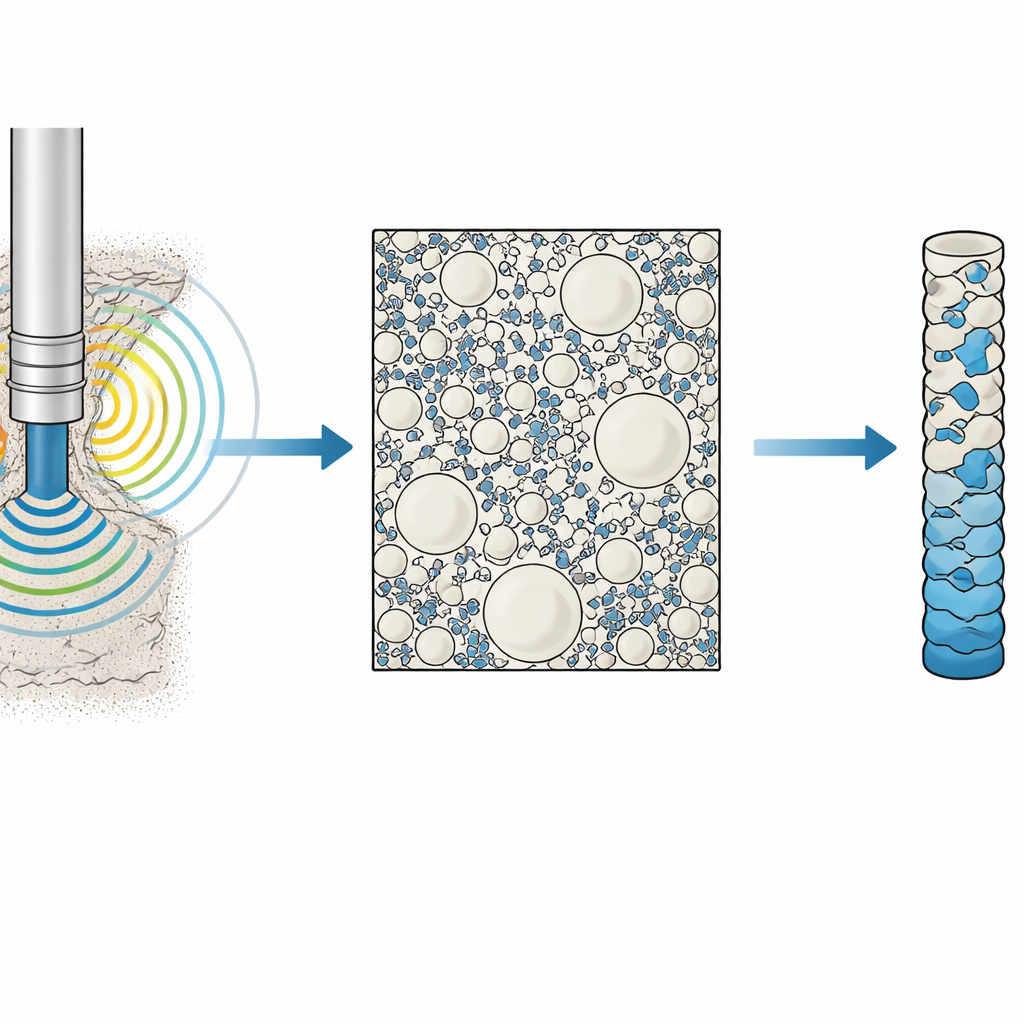
The authors link sonic measurements to pore geometry through a computational model that treats pores as tiny cavities embedded in an elastic solid. They describe pore shapes using a mix of simple “Euclidean” forms (such as smooth circular or star-like holes) and more complex “fractal” structures that mimic the rough, branching outlines seen in electron microscope images of sandstones. Using a boundary element method, they simulate how these mixed pore populations deform when pressure changes, and from that response infer bulk elastic properties and porosity. A key advance is imposing fractal scaling laws on the population of small pores: instead of allowing many different pore distributions that all fit the same elastic data, the model forces the number of pores at each size to follow a measured, repeatable pattern. This greatly reduces the long-standing problem that very different pore structures can look identical to sonic waves.
From pore shapes to capillary behavior
Once a plausible pore network is established, the framework converts it into a capillary pressure curve. First, it relates cumulative pore volume to fluid saturation, treating total porosity as 100% filling. Then, it translates each pore’s perimeter into an “equivalent throat radius”—the largest circle that can fit inside the pore opening—using numerical methods that track inscribed circles along the pore’s long axis. Applying a standard physical relationship between throat radius and capillary pressure turns the entire pore-size distribution into a predicted capillary curve. Because the fractal rules tie the abundance of small, deformable pores to observed elastic behavior, the resulting curve is not just a fit to data; it is a direct consequence of the pore geometry required to match the sonic logs.
Testing the method in real oil fields
The researchers applied their approach to two sandstone reservoirs with very different data situations. In Ecuador’s Tapi–TTT Oilfield, some logs were missing, so they reconstructed porosity and density using established relations between sonic travel time and rock properties. In Venezuela’s Las Piedras Formation, a more complete and higher-quality log suite was available. For each case, they calibrated the elastic model with dipole sonic data, built a mixed Euclidean–fractal pore population, and generated synthetic mercury capillary curves. These curves closely tracked laboratory measurements, capturing not only overall porosity but also key features such as the proportion of large “megapores,” irreducible water saturation, and the transition from bound to free fluid. Errors remained within a few percent for sandstone-like fractal dimensions, and deviations grew only when the fractal parameters were pushed beyond the range supported by independent imaging studies.
What this means for future subsurface studies
For a lay reader, the practical message is that engineers can increasingly “hear” what the rock would have told them in the lab, without needing to bring it to the surface. By combining realistic fractal descriptions of pore walls with well-established acoustic physics, this method turns routine sonic logs into synthetic capillary pressure curves that agree well with laboratory benchmarks. When adequate log coverage is available, it offers a faster, cheaper, and more widely applicable alternative to traditional core-based testing, especially in reservoirs where samples are scarce or difficult to handle. Although the current work focuses on clean, well-consolidated sandstones, the authors outline how the same strategy could be extended to certain carbonates and shales once their fractal properties are measured, promising broader use of this “virtual laboratory” approach in future energy and groundwater projects.
Citation: Galarza-Alava, J., Mendoza-Sanz, J. Synthetic capillary pressure modeling with dipole sonic waves for enhanced reservoir characterization. Sci Rep 16, 11697 (2026). https://doi.org/10.1038/s41598-026-47717-x
Keywords: capillary pressure, dipole sonic logs, fractal pore structure, reservoir characterization, sandstone porosity