Clear Sky Science · en
Machine learning-based correlation of charpy impact properties between sub-sized and standard-sized specimens for nuclear structural materials
Why small metal samples matter
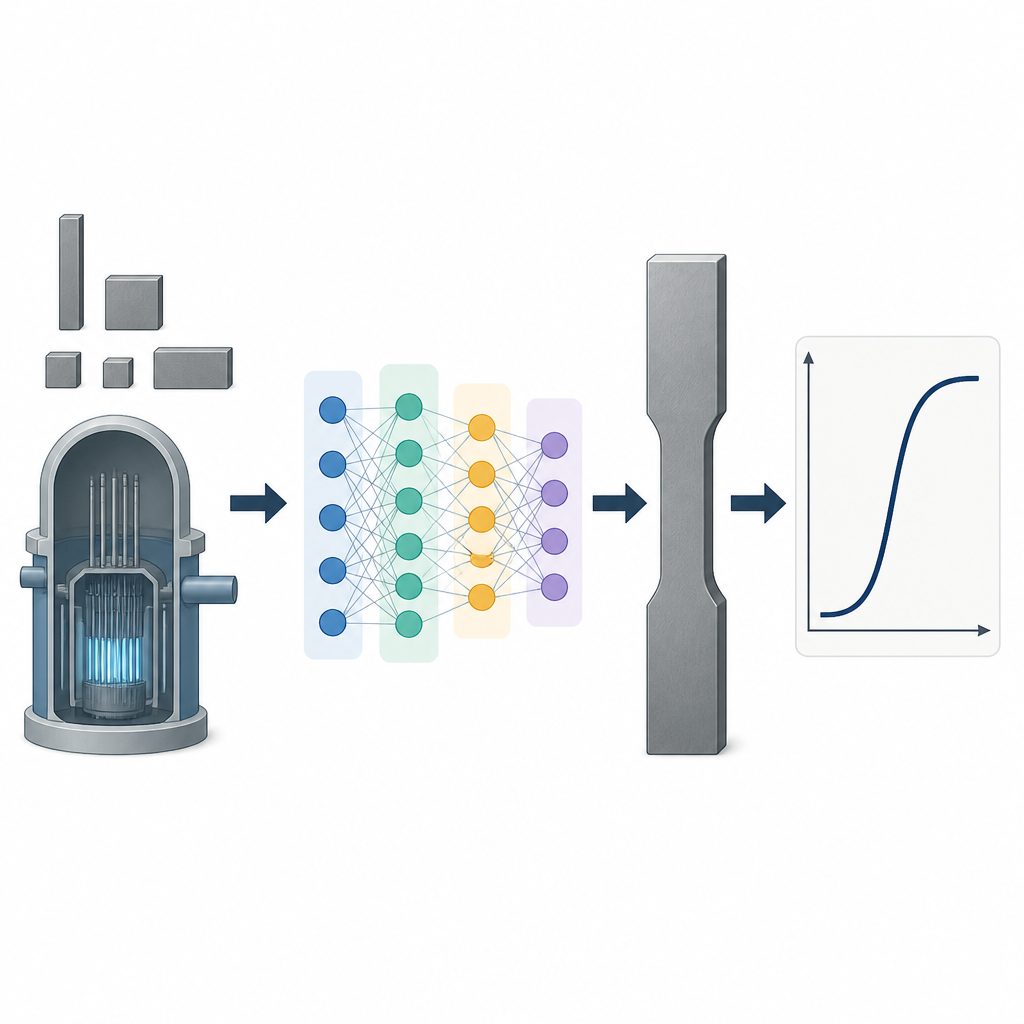
When engineers check the safety of nuclear power plants, they often need to know how tough a steel part really is without cutting out a large chunk of it. That is especially true for the thick steel walls of a reactor vessel, where material is scarce, highly radioactive, and difficult to access. This study shows how modern machine learning can translate test results from tiny metal samples into reliable estimates of how full‑size parts will behave, helping extend reactor lifetimes while keeping safety margins clear.
How we normally smash steel
Engineers commonly use the Charpy impact test to judge how much energy a metal can absorb before it breaks. A small bar of steel with a notch is struck by a swinging hammer, and the lost swing energy reveals how tough the sample was. Repeating the test at different temperatures draws an S‑shaped curve with three regions: a low‑energy brittle zone, a high‑energy ductile zone, and a steep transition in between. Two key numbers come from this curve: the upper shelf energy, which tells how much energy the steel can absorb when it behaves in a ductile way, and the ductile‑to‑brittle transition temperature, which marks the temperature where the material shifts from brittle to ductile fracture.
Why small samples give tricky answers
In many nuclear applications, only small slices of steel are available, so engineers use reduced‑size versions of the Charpy sample. These tiny pieces do not break in exactly the same way as full‑size bars. Their geometry changes the stress pattern at the notch and the mix of brittle and ductile fracture on the broken surface. As a result, they usually absorb less energy and may appear tougher or more brittle than the original material, depending on temperature. Over the years, researchers have proposed many mathematical rules to convert results from small bars to full‑size equivalents, using simple scaling laws or empirical formulas. However, these rules often work well only for particular steels, heat treatments, or specimen shapes, and they struggle to capture the full complexity of real data.
Letting data teach the conversion
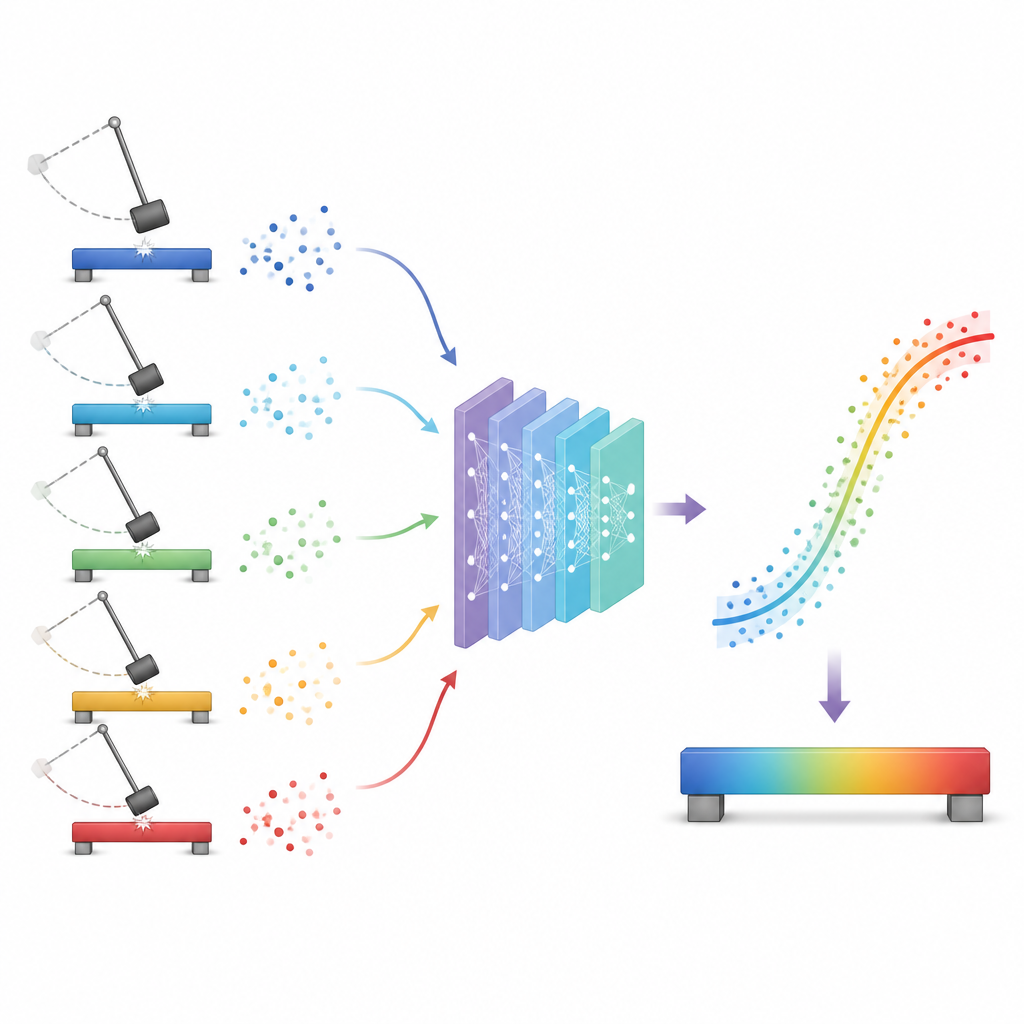
The authors build a data‑driven framework that lets the conversion emerge from the measurements themselves. First, they collect a large open dataset of more than 4800 Charpy tests on several reactor steels and then focus on 389 paired tests where both sub‑sized and full‑size samples of the same SA533B steel were tested under matching conditions. For each pair, they mathematically shift the small‑sample temperature data so that the transition point lines up with that of the full‑size sample, and they rescale the energy differences so that the overall curve height matches. These transformed points define what the full‑size response should look like, while preserving the natural scatter seen in experiments. A machine learning model is then trained to learn the mapping from all known inputs, including chemistry, heat treatment, irradiation history, geometry, and the small‑sample test point, to the transformed full‑size temperature and energy.
How well the machine learns the curve
Once trained, the model can take a set of measurements from sub‑sized samples and predict what the full‑size impact curve would be, without ever seeing the actual full‑size test data. The researchers then fit a smooth S‑shaped curve through these predictions to extract the corresponding upper shelf energy and transition temperature. Compared with traditional formulas, the best machine learning models, especially gradient boosting trees, match the measured full‑size values more closely. They reach coefficients of determination of about 0.94 for upper shelf energy and 0.89 for transition temperature, noticeably better than the best analytical methods. The team also uses modern explainability tools to show which inputs matter most: the measured small‑sample energy and temperature, specimen dimensions, and certain alloying elements are among the strongest influences.
Adding a measure of confidence
Because safety decisions depend on knowing not just a single value but also its uncertainty, the authors go further and quantify how confident the predictions are. They combine statistical information from the curve fitting with uncertainty estimates from some of the machine learning models to build confidence and prediction intervals for the key properties. In many cases, the machine learning‑based correlated values fall within the same uncertainty bands as the true full‑size measurements, suggesting that the new method can provide both accurate and cautious estimates.
What this means for real‑world safety
For a non‑specialist, the main message is that carefully trained machine learning models can act as translators between tests on tiny metal pieces and the behavior of full‑size nuclear components. By capturing patterns across many steels, treatments, and irradiation conditions, this approach can improve the use of scarce or highly irradiated material, support long‑term monitoring of reactor vessels, and help design new alloys using only miniature tests. The framework still needs to be checked on more materials, but it points toward a future where data‑driven tools make structural safety assessments more reliable even when only small samples are available.
Citation: Sreenivasulu, Y.K., Lee, I., Merickel, J.W. et al. Machine learning-based correlation of charpy impact properties between sub-sized and standard-sized specimens for nuclear structural materials. Sci Rep 16, 16202 (2026). https://doi.org/10.1038/s41598-026-47605-4
Keywords: Charpy impact test, machine learning, nuclear materials, fracture toughness, sub-sized specimens