Clear Sky Science · en
Enhancing polygenic risk prediction by modeling quantile-specific genetic effects
Why predicting genetic risk is harder than it sounds
Genetic risk scores promise to tell us who is more likely to develop conditions like diabetes or heart disease, but today’s tools mostly assume that genes nudge everyone’s risk in the same simple way. Many real-world traits, however, are lopsided: most people have normal values while a smaller group sits in a high-risk tail. This study introduces a new way to build genetic risk scores that looks not just at the average person, but at how genes behave across the full range of outcomes, especially in those high‑risk tails that matter most for health decisions.
Looking beyond the average person
Standard polygenic risk scores add up the tiny effects of hundreds or thousands of DNA variants to estimate a person’s overall genetic predisposition to a trait or disease. These scores are usually based on methods that focus on the average outcome in a population. That works well when a trait is roughly symmetric, like height in many groups. But for blood measures such as glucose and triglycerides, the distribution is skewed: most people cluster at healthy levels, while a minority have much higher values. Prior work has hinted that some genetic variants mainly influence the extremes rather than the middle, meaning that a single “average-based” score can miss important signals.
A new way to score genetic risk across the spectrum
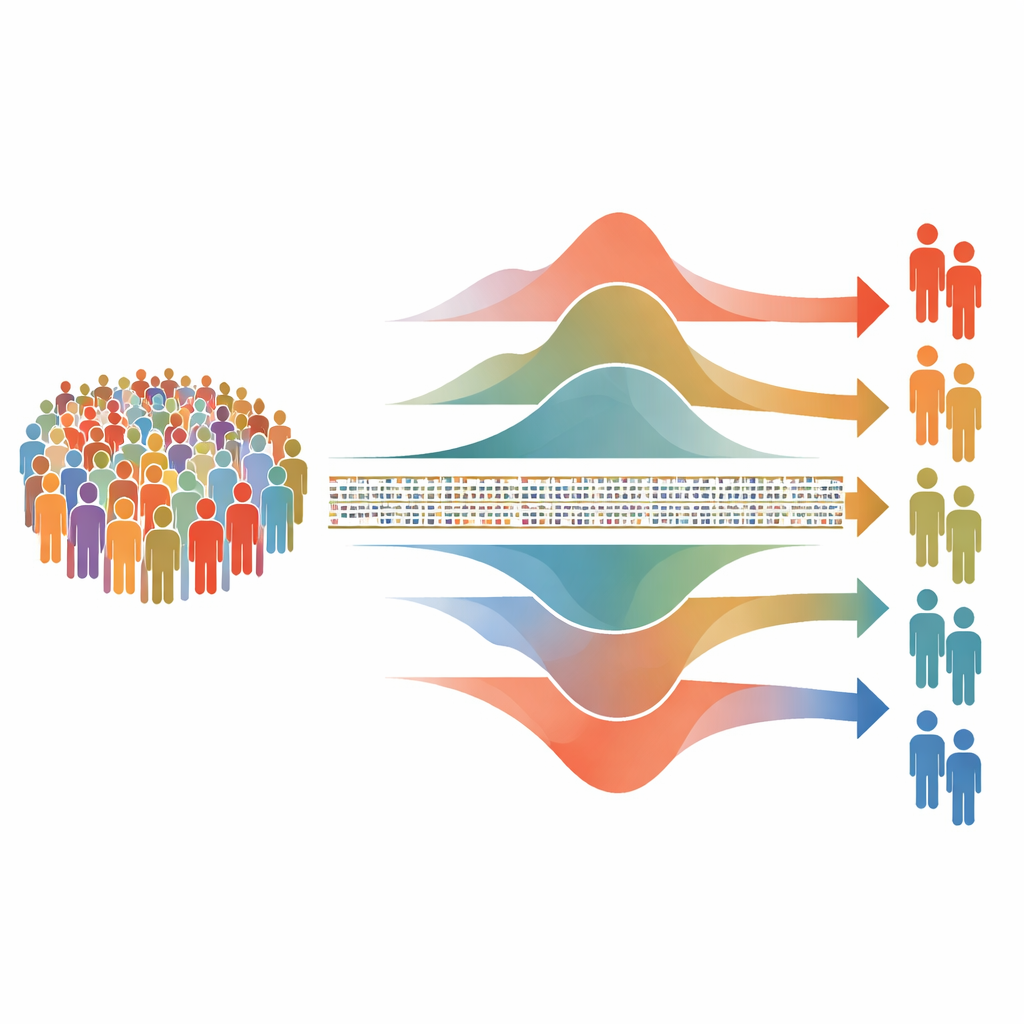
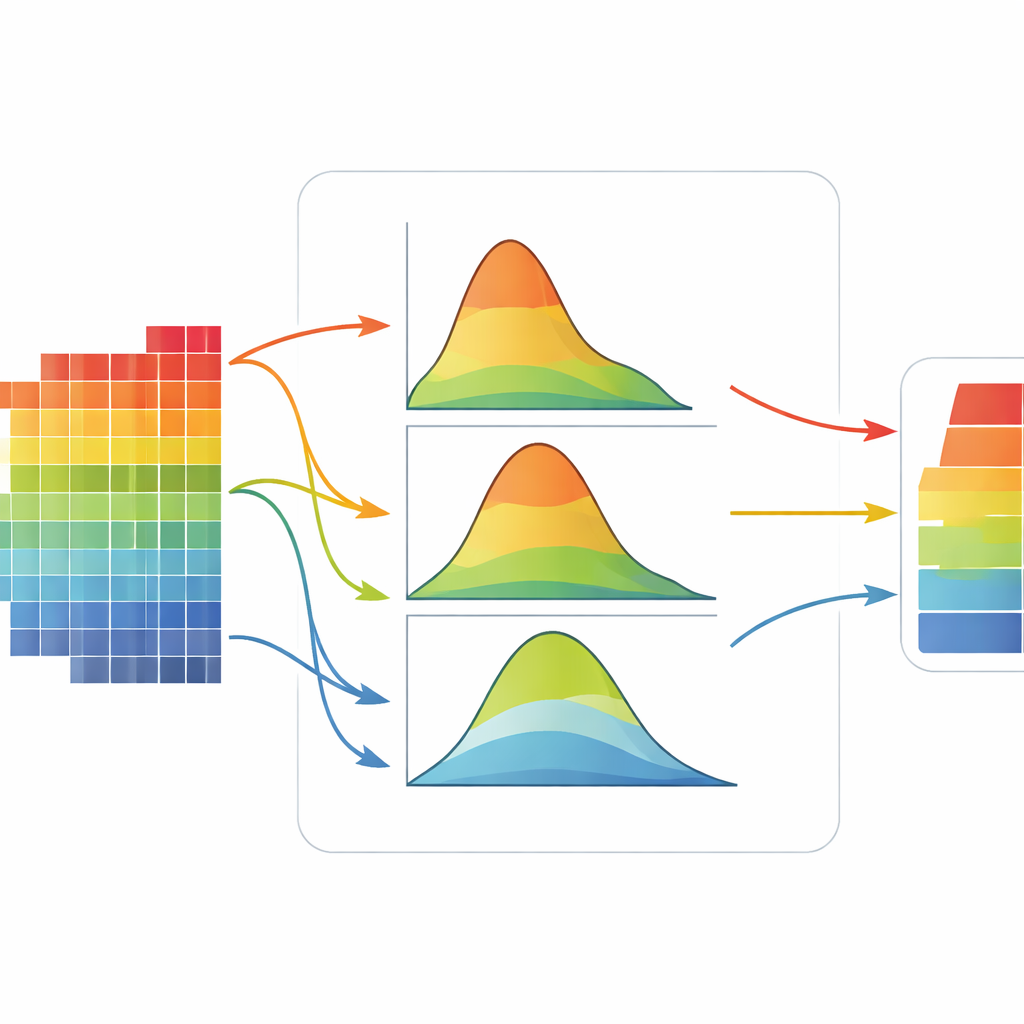
The researchers developed a method called quantile-based polygenic risk scoring, or QPRS. Instead of estimating one genetic effect for each DNA variant, QPRS measures how that effect changes across several points of the trait distribution, from low to high. Technically, this uses quantile regression, which models, for example, the 10th, 50th, or 90th percentile of a trait rather than just its mean. For each percentile, the team performs a genome-wide scan to estimate variant effects, selects informative variants using standard filtering tools, and builds a separate risk score. These multiple scores—one for each percentile—are then fed together into a prediction model, so the final risk estimate reflects genetic influences acting at different parts of the distribution.
Testing the method with simulated and real genomes
To see when QPRS helps, the authors first ran controlled simulations using real genetic data from a large Korean cohort. In one set of scenarios, some genetic variants were designed to alter how much the trait varied, rather than its average level, mimicking variants that mainly affect the tails of the distribution. In this setting, QPRS more accurately predicted low and high percentiles of the trait than conventional scores, substantially reducing prediction error, especially when trait values were noisy or strongly skewed. It also recovered more of the truly influential variants, showing that modeling the full distribution can uncover signals that average-based methods overlook. In another set of simulations plagued by extreme outliers, QPRS was generally more robust than standard approaches, though under very severe distortion a simpler, median-focused version of the method performed best.
What the data say about blood fats and sugar
The team then applied QPRS to real-world data from over eight thousand adults in the Korean Genome and Epidemiology Study, focusing on post‑challenge blood glucose and blood triglycerides, both key markers of metabolic health. These traits are strongly right‑skewed, with a pronounced tail of high‑risk individuals. For triglycerides, QPRS clearly outperformed a range of popular scoring methods, both when used alone and when combined with clinical factors such as age, body mass index, and smoking status. For glucose, where overall genetic signal was weaker after accounting for clinical factors, gains were more modest but still visible, particularly when QPRS was added on top of traditional scores. The analysis also revealed individual genetic variants whose effects flipped or changed strength between low and high parts of the glucose distribution—patterns that a single average-based estimate would largely hide.
What this means for genetic risk prediction
This work shows that treating genetic risk as a single number tied to the average outcome can be misleading for traits with lopsided or highly variable distributions. By explicitly modeling how genetic effects differ across the full spectrum of a trait, QPRS sharpens risk prediction, especially for people in the high‑risk tails that clinicians most worry about. It also provides a richer picture of how genes shape disease-related traits, highlighting variants that matter specifically for extreme values. In the long run, combining traditional mean-based scores with quantile-aware approaches like QPRS could lead to more nuanced and informative genetic risk tools for personalized medicine.
Citation: Kim, S., Goo, T., Park, T. et al. Enhancing polygenic risk prediction by modeling quantile-specific genetic effects. Sci Rep 16, 11749 (2026). https://doi.org/10.1038/s41598-026-47082-9
Keywords: polygenic risk scores, quantile regression, genetic prediction, blood lipids, type 2 diabetes