Clear Sky Science · en
A novel fine-scale identification method for coal mining subsidence basin based on TS-InSAR and subsidence curve characteristics
Why sinking ground matters to everyday life
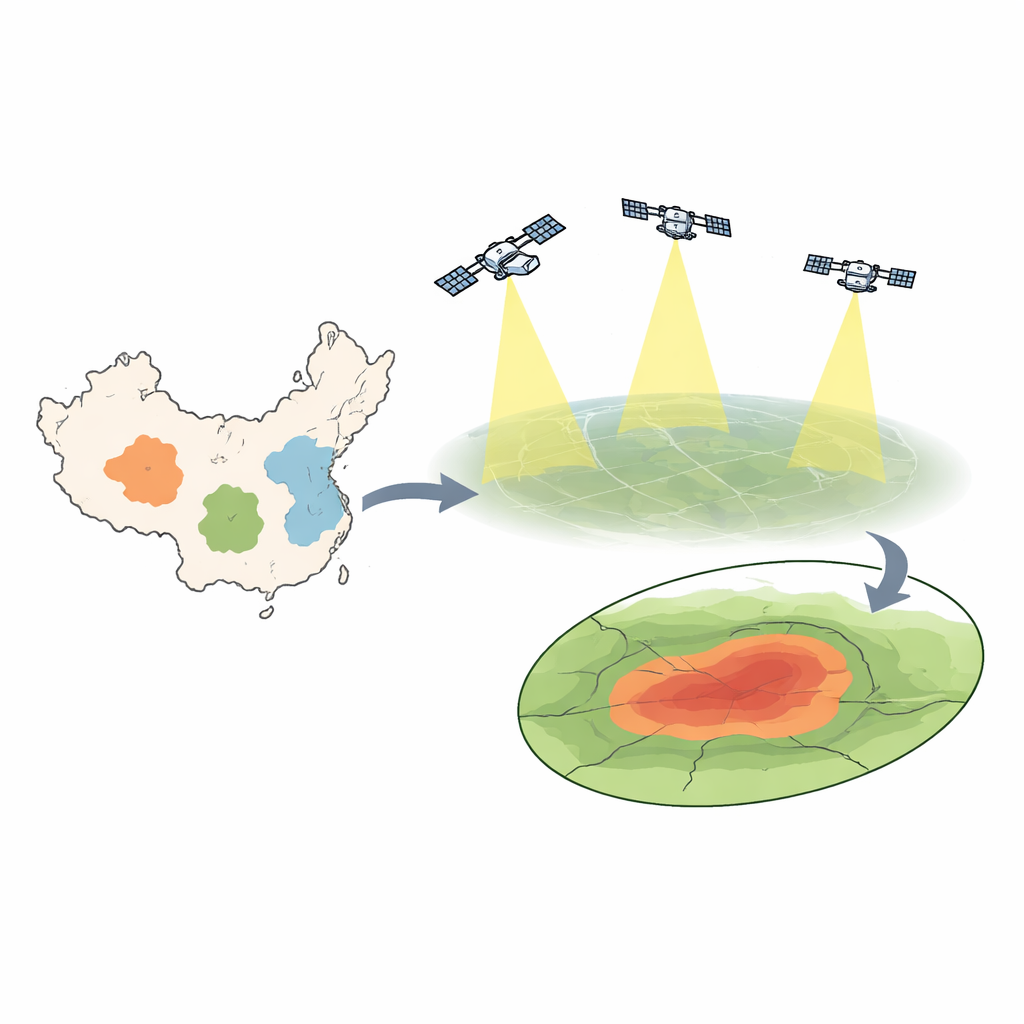
Across many parts of China, coal dug from deep underground quietly reshapes the land above. As rock layers collapse into emptied seams, the ground surface can slowly sink, forming broad shallow bowls called subsidence basins. These hidden changes threaten homes, roads, pipelines, farmland, and fragile grasslands. The paper behind this article introduces a new way to spot and outline these sinking zones quickly and accurately using radar satellites and smart pattern recognition, offering a powerful tool for safer mining and better land protection.
Watching the ground from space
The researchers rely on a satellite technique called InSAR, which measures how Earth’s surface rises or falls by comparing radar signals over time. Modern missions like Sentinel-1 repeatedly scan wide swaths of land, detecting ground motion as small as a few millimeters. By assembling many images into a time series, the team can track how each point on the ground moves month after month. This broad, precise coverage makes it possible to monitor vast coal regions in eastern, central, and western China without installing dense networks of ground sensors.
The telltale shape of mining subsidence
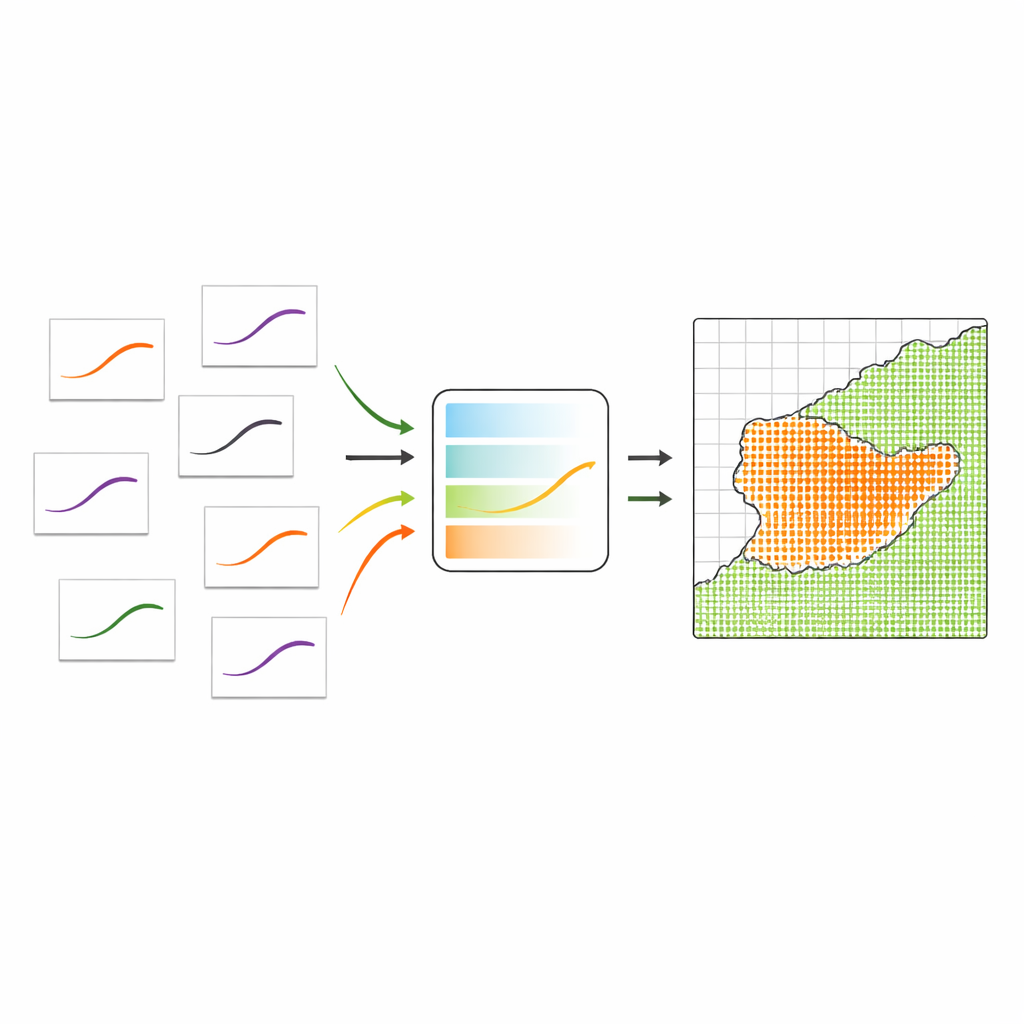
Decades of field measurements have shown that ground sinking above active coal faces tends to follow a characteristic pattern. When mining begins beneath a location, the surface first settles slowly, then speeds up, and finally tapers off as the underground void stabilizes, creating an S-shaped curve when subsidence is plotted over time. In contrast, areas not affected by mining usually move very little or show irregular, low-amplitude changes driven by seasonal water, natural compaction, or other local factors. The authors realized that these curve shapes, not just the total amount of sinking, could be used as a fingerprint to distinguish mining damage from other deformation.
Turning curves into data the computer can learn
To make use of this fingerprint, the team built a large library of time-series subsidence curves. They combined 564 carefully surveyed ground points from several coal regions with 10,000 realistic curves generated from established mathematical models of mining subsidence, and 20,000 additional curves from areas showing no significant deformation in the satellite data. Each curve was standardized: its time span was rescaled to a common frame and its sinking values were normalized, then sampled at ten evenly spaced moments, with the maximum sinking kept as an extra feature. This produced a compact set of 11 numbers per location that captured both the shape and size of its motion history.
Teaching a model to trace invisible mine boundaries
With this feature library in hand, the researchers trained a weighted support vector machine, a type of machine learning method well suited to small yet informative datasets. Because truly subsiding pixels are far fewer than stable ones, they adjusted the model to pay extra attention to the minority class so that subtle basins would not be overlooked. Once trained, the model could be applied pixel by pixel to InSAR time series from any mining district, classifying each location as mining-induced subsidence or not. Tests in three very different coalfields—urban, village, and grassland settings—showed that the algorithm successfully recovered the full shapes of subsidence basins and remained sensitive even to late-stage, slow residual sinking after mining stopped.
Putting numbers on success in the field
To judge how well their approach worked, the team compared the model’s predicted basin edges with precise leveling measurements along survey lines on the ground. They focused on the contour where cumulative sinking reaches 10 millimeters, a critical threshold in Chinese engineering practice for the onset of building damage. The new method not only achieved nearly 99 percent overall accuracy in tests, but also improved the boundary position at this 10-millimeter line by about 80 percent compared with a previous InSAR-based technique that relied on simpler time-series matching. Adding simulated curves to the training data further boosted accuracy by enriching the range of behaviors the model could recognize.
What this means for mines, communities, and landscapes
For non-experts, the key message is that we can now map where coal mining is quietly pulling the land down with much finer detail and with far less local calibration than before. By learning the typical “heartbeat” of mining-related sinking from a mix of field and modeled data, and then reading that heartbeat in satellite records, the method can rapidly outline the true reach of underground workings—even in new districts where no prior satellite history exists. This sharper picture of risk zones can guide safer mine planning, building protection, reclamation efforts, and environmental restoration, helping balance energy production with the long-term health of towns, farms, and ecosystems that sit above the seams.
Citation: Huang, S., Zhang, Y., Yan, Y. et al. A novel fine-scale identification method for coal mining subsidence basin based on TS-InSAR and subsidence curve characteristics. Sci Rep 16, 10875 (2026). https://doi.org/10.1038/s41598-026-45625-8
Keywords: coal mining subsidence, satellite radar InSAR, ground deformation mapping, machine learning classification, land surface monitoring