Clear Sky Science · en
Enabling cross-indication protein expression analysis using a curated pan-cancer dataset and a tailored workflow
Why Comparing Cancer Proteins Is So Hard
Cancer drugs increasingly aim at the same biological target across many tumor types, but deciding where a target matters most is not straightforward. Today, large public projects like the National Cancer Institute’s CPTAC generate detailed protein measurements from thousands of tumors. Yet these measurements are produced in different centers, at different times, and with different quirks. As a result, simply asking “is this protein higher in lung cancer than in kidney cancer?” can give misleading answers. This study describes a practical, data-driven way to clean, complete, and align these complex protein datasets so that fair comparisons across cancer types become possible.
Building a Shared Map of Cancer Proteins
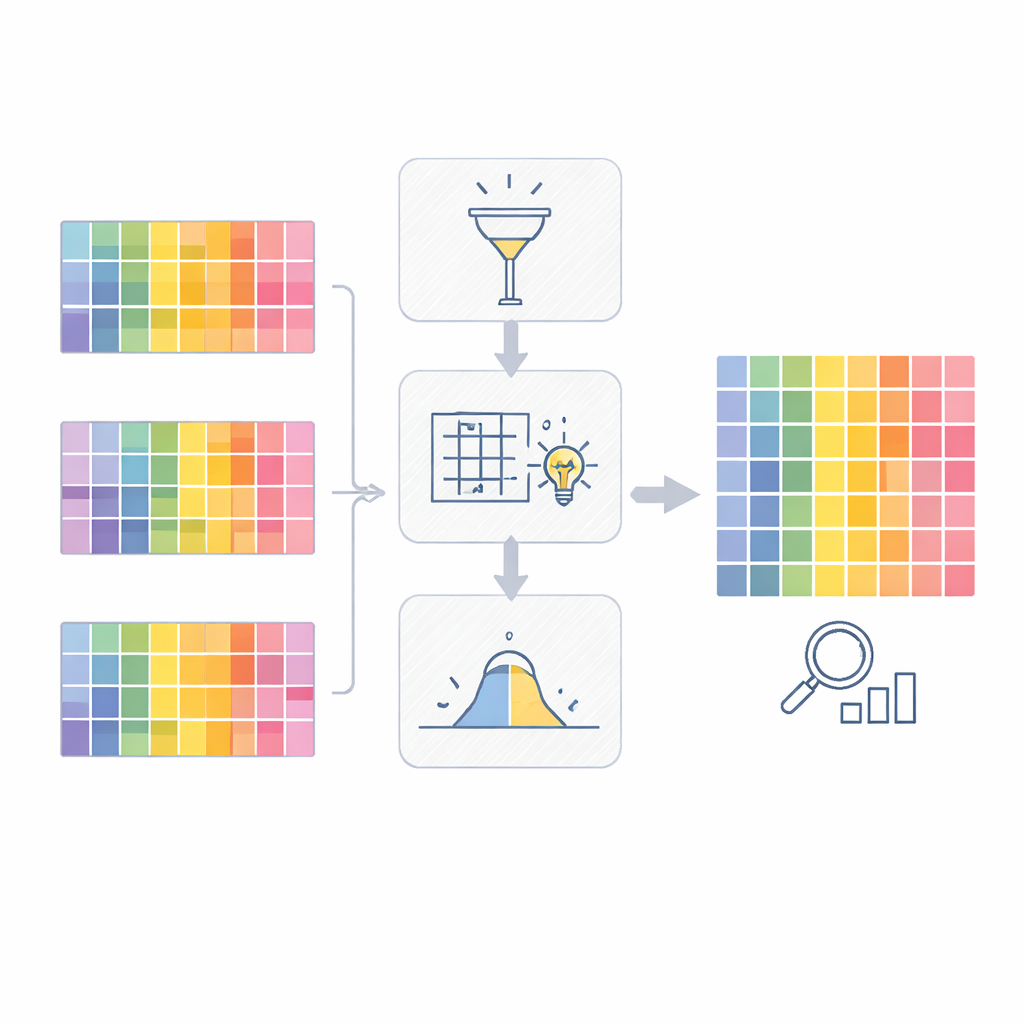
The authors start with CPTAC’s pan-cancer collection: more than a thousand tumors and matched normal tissues from ten cancer types, all measured by mass spectrometry. These experiments capture thousands of proteins per sample, but not always the same proteins in every tumor, and not with the same overall distribution across cohorts. The team first reprocessed all raw data using a single computational pipeline so that every cohort was treated consistently. They then focused on a core set of more than 10,000 “robustly expressed” proteins—ones that are reasonably abundant and rarely missing in at least one cancer type—so that cross-cancer comparisons rest on stable measurements rather than on patchy signals.
Filling in the Blanks Without Distorting the Picture
Even after careful selection, many protein values are still missing. Some are absent at random, much like occasional typos; others are missing because the protein level fell below the instrument’s detection limit. Treating all missing values the same can bias results. The authors therefore used a “cohort hybrid” strategy that treats different missingness patterns differently within each cancer type. For proteins that look simply under-sampled, they borrow information from similar samples to estimate the missing values. For proteins that appear consistently too low to detect, they use a method tailored to left-censored data, effectively placing those values near the instrument’s lower limit. This nuanced approach aims to restore a realistic picture of protein levels without inventing artificial differences.
Making Distributions Comparable Across Cancers
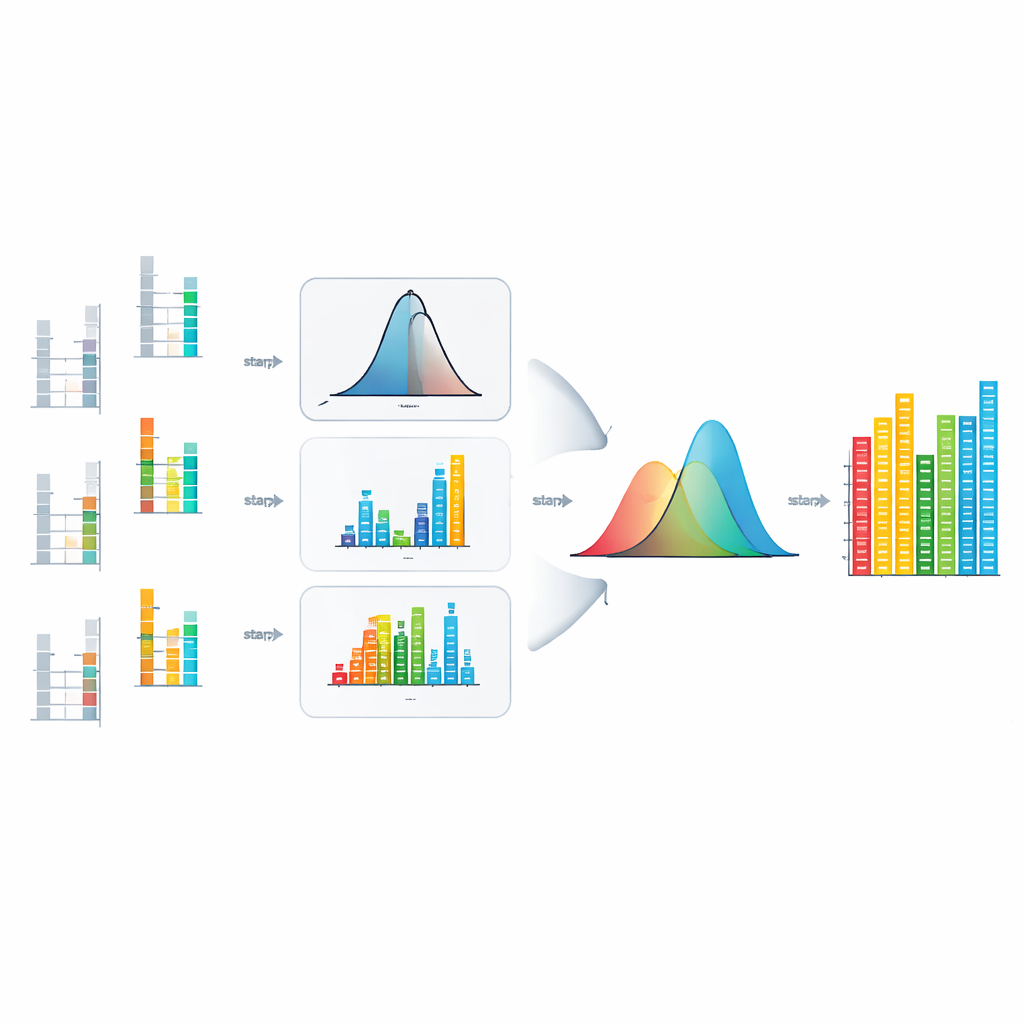
Once the gaps are filled, another problem remains: some cohorts overall show higher or more variable protein signals than others, mostly due to technical factors such as sample preparation or instrument calibration. To correct this, the team converts protein intensities into an absolute-like measure and then tests two normalization strategies. One, called global quantile normalization, forces all samples—across all cancers and tissues—to share the same overall distribution of protein values. The other, “smooth” quantile normalization, harmonizes samples within each cancer type or tissue while allowing differences between groups. By examining patterns of variation and performing many sensitivity checks, the authors show that global quantile normalization best reduces unwanted technical differences while still preserving meaningful biological contrasts, such as tumor–versus–normal changes.
Checking Against Independent RNA Data
To see whether their cleaned protein dataset behaves realistically across cancer types, the authors turn to RNA measurements from The Cancer Genome Atlas. For a small group of proteins whose levels closely track their corresponding RNA across cancers, they compare how different tumor types rank in protein expression versus RNA expression. If the cross-cancer normalization is successful, these rankings should agree. Indeed, the combination of cohort hybrid imputation and global quantile normalization yields the highest rank agreement between protein and RNA, outperforming both unnormalized data and the alternative normalization method. Additional tests show that key biological signals—such as which proteins change between tumors and normal tissues, and which cellular pathways are altered—remain largely stable after the full processing workflow.
What This Means for Future Cancer Research
In plain terms, this work turns a noisy, uneven collection of protein measurements into a more reliable, shared reference for comparing cancers. By carefully deciding which proteins to keep, how to fill in missing values, and how to align distributions across studies, the authors create a pan-cancer protein resource that better matches independent RNA data and preserves tumor biology. This standardized dataset and its open workflow can help researchers rank drug targets across many tumor types, spot cancer-selective proteins, and generate new hypotheses for treatment—accelerating the path from large-scale data to practical advances in oncology.
Citation: Wang, J., Tian, X., Yu, W. et al. Enabling cross-indication protein expression analysis using a curated pan-cancer dataset and a tailored workflow. Sci Rep 16, 14623 (2026). https://doi.org/10.1038/s41598-026-44872-z
Keywords: pan-cancer proteomics, protein expression normalization, CPTAC, missing data imputation, cancer target discovery