Clear Sky Science · en
Effect of using different fundus cameras and image resolutions on automatic measurements of retinal vascular parameters
Why pictures of the eye can tell different stories
Doctors increasingly use photographs of the back of the eye to learn about heart and brain health, because the tiny blood vessels there mirror what happens in the rest of the body. But these images are taken with many different cameras and settings. This study asks a simple but crucial question: do those technical differences quietly change the numbers that doctors and researchers read from eye photos—such as how wide, twisted, or complex the vessels look—enough to affect diagnosis and research?
Looking at the body through the eye
The blood vessels in the retina, the light-sensitive layer at the back of the eye, can be seen directly and non‑invasively. Over the last decade, large studies have shown that the width, shape, and branching pattern of these vessels are linked to high blood pressure, diabetes, stroke, heart and kidney disease, and certain eye conditions. To turn eye photos into useful numbers, researchers use specialized computer programs that measure average vessel width, how winding the vessels are, and how richly they branch. These measurements are increasingly used as potential early warning signs of disease and as markers to track treatment effects.
How the study tested cameras and image sharpness
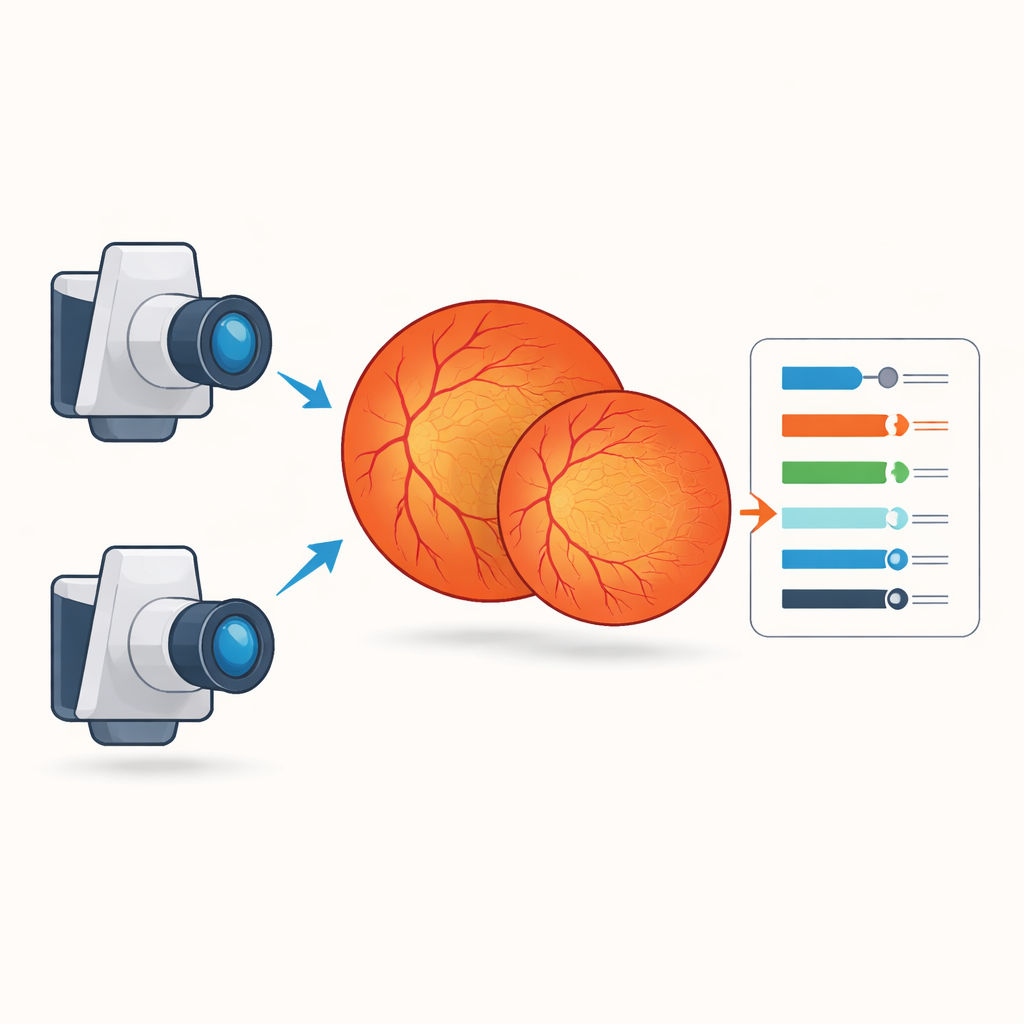
The authors worked with 54 eye images from 27 healthy adults, each photographed on the same day with two popular fundus cameras from different manufacturers. They analyzed all images with the same semi‑automatic software, called VAMPIRE, which identifies the optic nerve, finds the main arteries and veins, and calculates vessel width, tortuosity (how curly the vessels are), and a "fractal" measure that captures how complex the branching network is. First, they compared images from the two cameras after rescaling them to the same size, so only the camera hardware and built‑in processing differed. Then, using images from a single camera, they created several versions at successively lower resolutions to see how image sharpness alone influenced the measurements.
What changed when cameras were swapped
Even when the researchers forced both cameras’ images to have the same number of pixels, the measured vessel features did not match. Key values, such as average artery and vein width and the complexity of the vessel network, were systematically but modestly different between the two devices. For most of these parameters, the agreement between cameras was rated as only poor to moderate, meaning that numbers taken from one system could not be safely treated as if they came from the other. These small but consistent shifts are likely due to differences in optics, sensors, and the way each camera processes color and contrast before saving the picture.
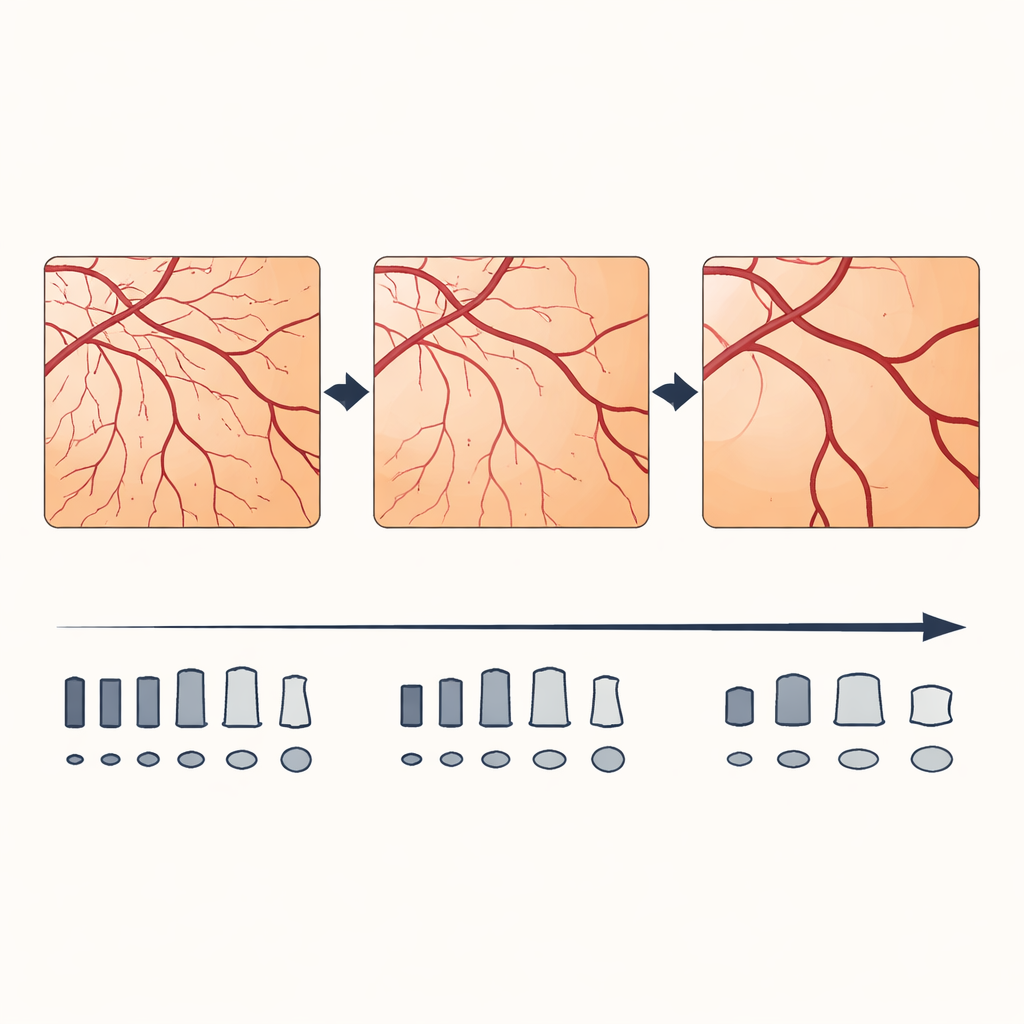
What happened when images were made coarser
When the same original eye image was saved at lower and lower resolution, the software reported that arteries and veins became wider, and that both arteries and veins looked more tortuous. At the same time, the calculated complexity of the vessel network fell, as fine branches were lost in the blur. These changes grew larger as resolution dropped. Statistical tests showed systematic and proportional biases: at lower resolution, the software compressed the range of values, making subtle differences between people harder to see and exaggerating or shrinking measurements depending on their starting size. Some summary ratios, such as the proportion between artery and vein width, were less affected, but their reliability also worsened as images became coarser.
Why this matters for patients and research
The main message for non‑specialists is that the numbers reported from eye photographs are not purely biological; they are also shaped by the camera and how sharp the image is. Studies that mix photos from different devices or resolutions without correction may draw misleading conclusions, and doctors cannot safely compare measurements taken with different setups as if they were identical. The authors argue that future work should standardize eye imaging to high, consistent resolution and develop methods to adjust for differences between cameras, so that retinal vessel measurements can truly serve as reliable, comparable markers of vascular health.
Citation: Cunnac, P., Boussat, B., Hogg, S. et al. Effect of using different fundus cameras and image resolutions on automatic measurements of retinal vascular parameters. Sci Rep 16, 14366 (2026). https://doi.org/10.1038/s41598-026-44196-y
Keywords: retinal imaging, fundus cameras, image resolution, vascular biomarkers, automated image analysis