Clear Sky Science · en
Multi-buffer zones reveal the relationship between spatial pattern of land surface temperature and land use indices in Guangzhou, China
Why city heat patterns matter
On a hot summer day, some parts of a city feel like a frying pan while others stay surprisingly cool. This study looks at why that happens in Guangzhou, a major city in southern China. By tracking how the ground warms and cools across different kinds of surfaces—buildings, bare soil, farms, forests, and water—the researchers show how urban growth reshapes local climate. Their findings can help city planners design greener, cooler neighborhoods that are more comfortable and healthier to live in.
Taking the city’s temperature from space
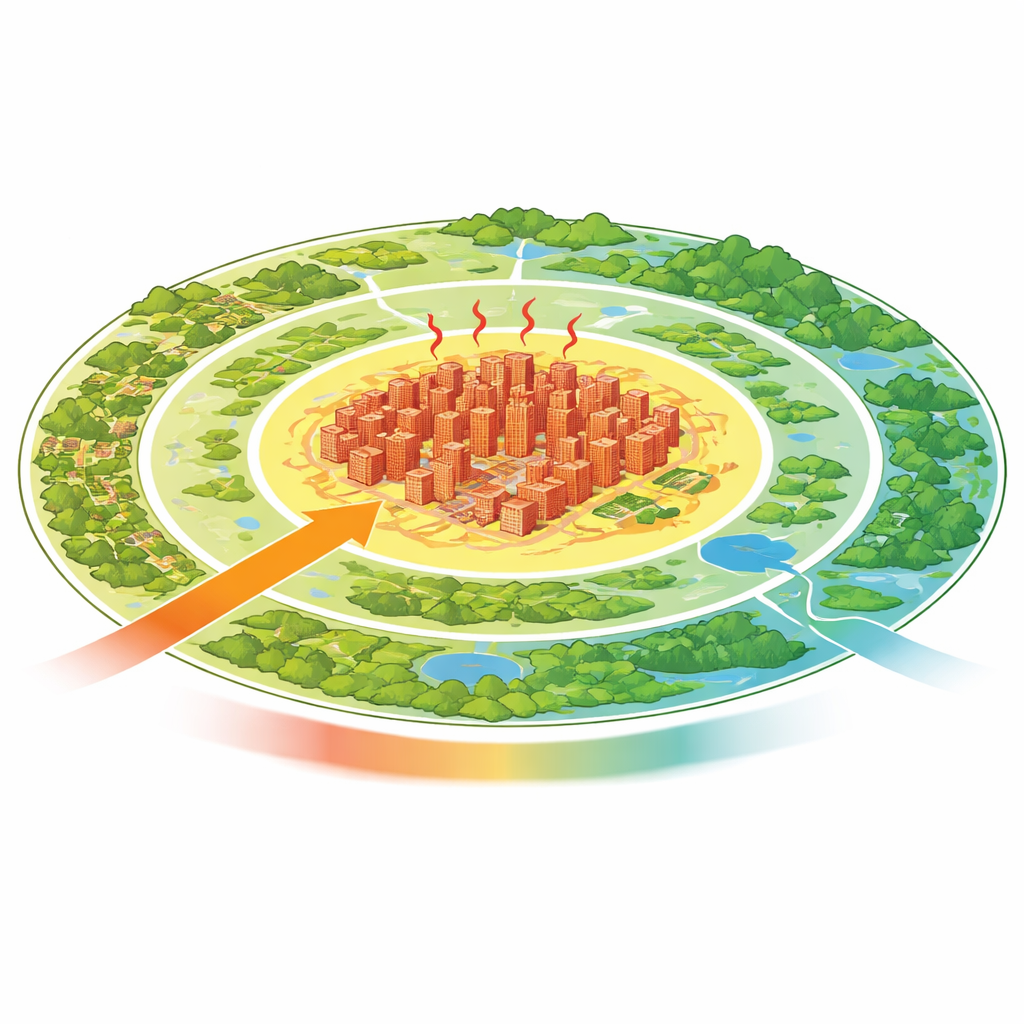
The team used Landsat satellites to “take the temperature” of Guangzhou’s land surface in four years between 2013 and 2022. These images reveal how hot or cool the ground is, from the crowded city center to distant suburbs and countryside. To make sense of the patterns, the researchers drew 120 concentric rings, each 1 kilometer wide, radiating out from the city center. For every ring, they calculated the average land surface temperature and several simple image-based indicators of what covers the ground: how green it is (vegetation), how built-up it is (buildings and paved areas), and how much surface water is present (rivers, lakes, ponds). This allowed them to see how temperature changes with distance from downtown and with different kinds of land use.
Hot cores, cool edges
The results show a clear “urban heat island” pattern. Overall, land surface temperature is highest near the city center and drops steadily toward the outskirts. In Guangzhou, the hottest zones form a V-shaped belt mainly in the western and southern urban areas, where dense buildings, roads, and other hard surfaces dominate. Cooler zones are found mostly in the northeast, where forests, farmland, and water bodies are more common. Across the years studied, areas with medium temperatures took up the largest share of the city, but the proportion of high-temperature zones grew from 2013 to 2019 before leveling off or slightly shrinking by 2022.
How different surfaces shape heat
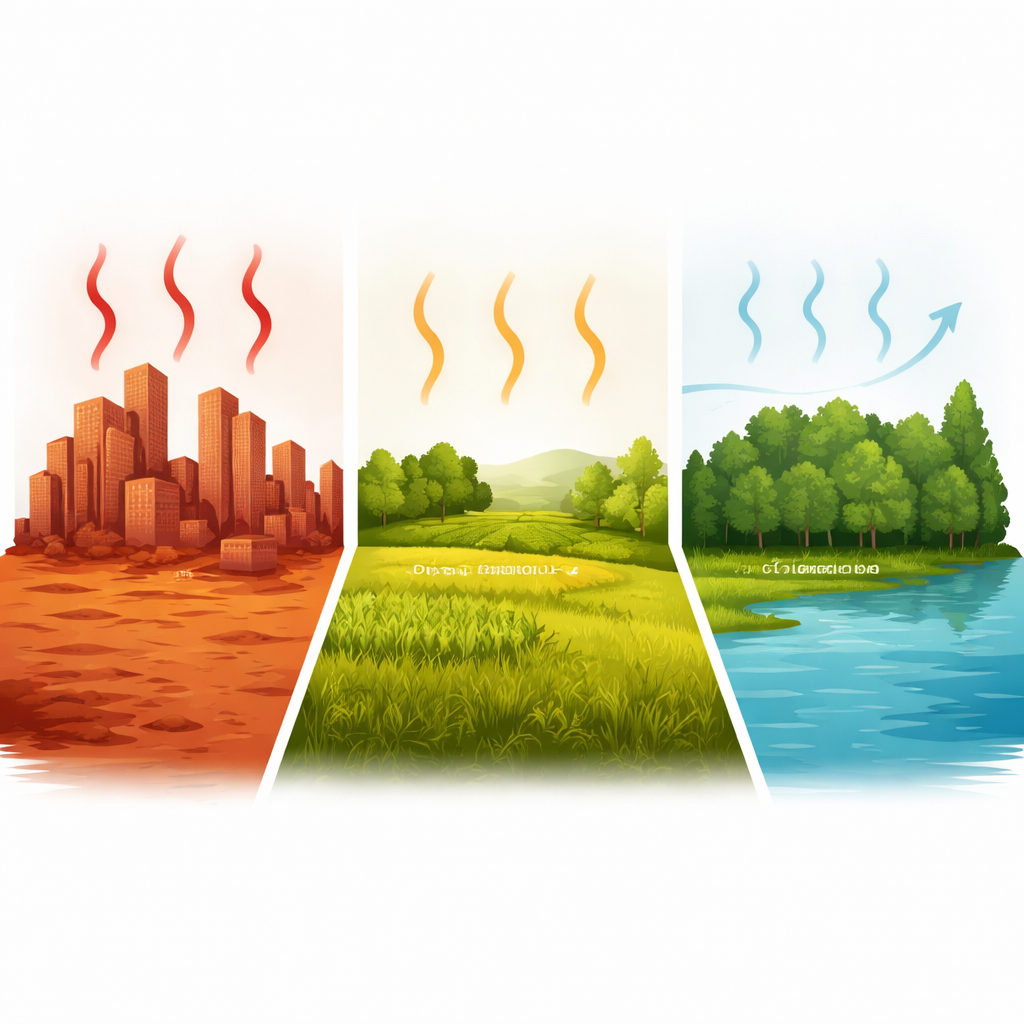
Not all land covers warm up in the same way. When the researchers grouped the city into broad types—barren land, impervious surfaces like concrete and asphalt, grassland, cropland, water, and forest—they found a distinct temperature ranking: barren land was hottest, followed by impervious surfaces, then grassland and cropland, with water and forests the coolest. Simple image indicators back this up. Where vegetation is dense, surface temperature tends to be lower. Where buildings and hard surfaces are concentrated, temperature tends to be higher. Water bodies also show a strong cooling effect, because water heats and cools more slowly than concrete or bare soil and can move heat downward and sideways instead of trapping it at the surface.
Distance, growth, and changing heat
By combining the ring-based distance approach with the land cover indicators, the study shows that both where land types are located and how they change over time matter for city heat. Vegetation becomes more abundant with distance from the city center, while built-up surfaces become less common. This helps explain why outer zones are cooler. Over the study period, the average difference between urban and rural surface temperatures increased, reflecting continuing urban expansion. At the same time, the slight reduction in the share of very hot areas after 2019 hints that green space, water features, or other planning measures may already be easing some of the worst heat in parts of Guangzhou.
Building cooler future cities
For everyday residents, the message is straightforward: where there is more concrete and bare ground, it feels hotter; where there are trees, parks, farms, and water, it feels cooler. The authors suggest that Guangzhou can curb excessive heat by prioritizing green roofs, networks of ventilation corridors that allow breezes to flow through dense districts, and new or restored wetlands and parks, especially within about 40 kilometers of the city center where heat is most intense. While the study notes that better land-use maps and more precise temperature measurements would sharpen future analyses, its overall conclusion is clear: thoughtful choices about how land is used can significantly soften the city’s heat, improving comfort and resilience as urbanization continues.
Citation: Liu, Z., He, K., Ke, Z. et al. Multi-buffer zones reveal the relationship between spatial pattern of land surface temperature and land use indices in Guangzhou, China. Sci Rep 16, 14247 (2026). https://doi.org/10.1038/s41598-026-44159-3
Keywords: urban heat island, satellite remote sensing, land use change, Guangzhou climate, green infrastructure