Clear Sky Science · en
Altitude-resolved prediction of roadside air pollution using UAV measurements and machine learning
Why pollution near highways matters
Many people live, work, or exercise near busy highways, where traffic fumes can quietly affect their health. Yet most air-quality monitors sit at fixed points on the ground and cannot show how pollution changes a few meters above or away from the road. This study combines drones and advanced computer models to create a three-dimensional picture of roadside air pollution, helping city planners and health researchers understand who is most exposed and when.
Using flying sensors to map dirty air
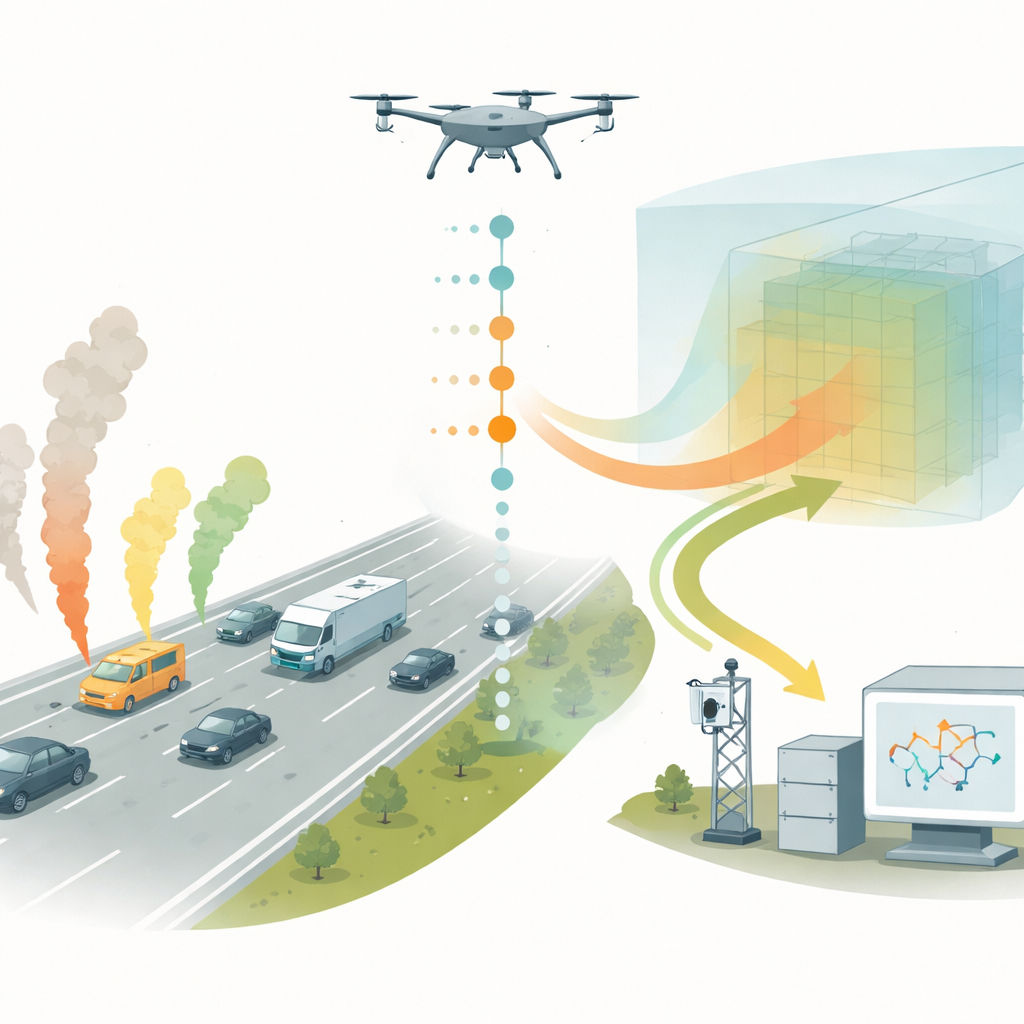
The researchers focused on a major Korean highway that connects Seoul and Busan and carries some of the country’s heaviest traffic. They installed a compact air sensor at a roadside station and attached a second, identical sensor to a quadcopter drone. The instruments measured four key pollutants: carbon monoxide from exhaust, nitrogen dioxide from fuel burning, ground-level ozone formed in sunlight, and fine particles known as PM2.5. Over several days in summer and winter, the drone flew up and down above the roadside at heights from 10 to 60 meters, and in winter also moved horizontally up to 60 meters away from the road, pausing at each point to sample the air.
What the drone saw above the road
The measurements revealed clear patterns in how pollution changes with height, distance, time of day, and season. Nitrogen dioxide and ozone were highest near the ground and decreased with altitude and distance from the highway, showing that vehicles are a dominant local source. Nitrogen dioxide spiked around 7 a.m., lining up with morning rush-hour traffic, while ozone was lowest at that time and higher in the bright afternoon, when sunlight drives chemical reactions in the air. In winter, nitrogen dioxide tended to be higher overall, helped by stagnant, cold layers of air that trap emissions near the surface. Surprisingly, fine particle levels were higher in summer than winter; by tracing air-mass paths backward over 48 hours, the team found that summer air often arrived from industrial regions of eastern China, hinting that long-distance transport added to local traffic pollution.
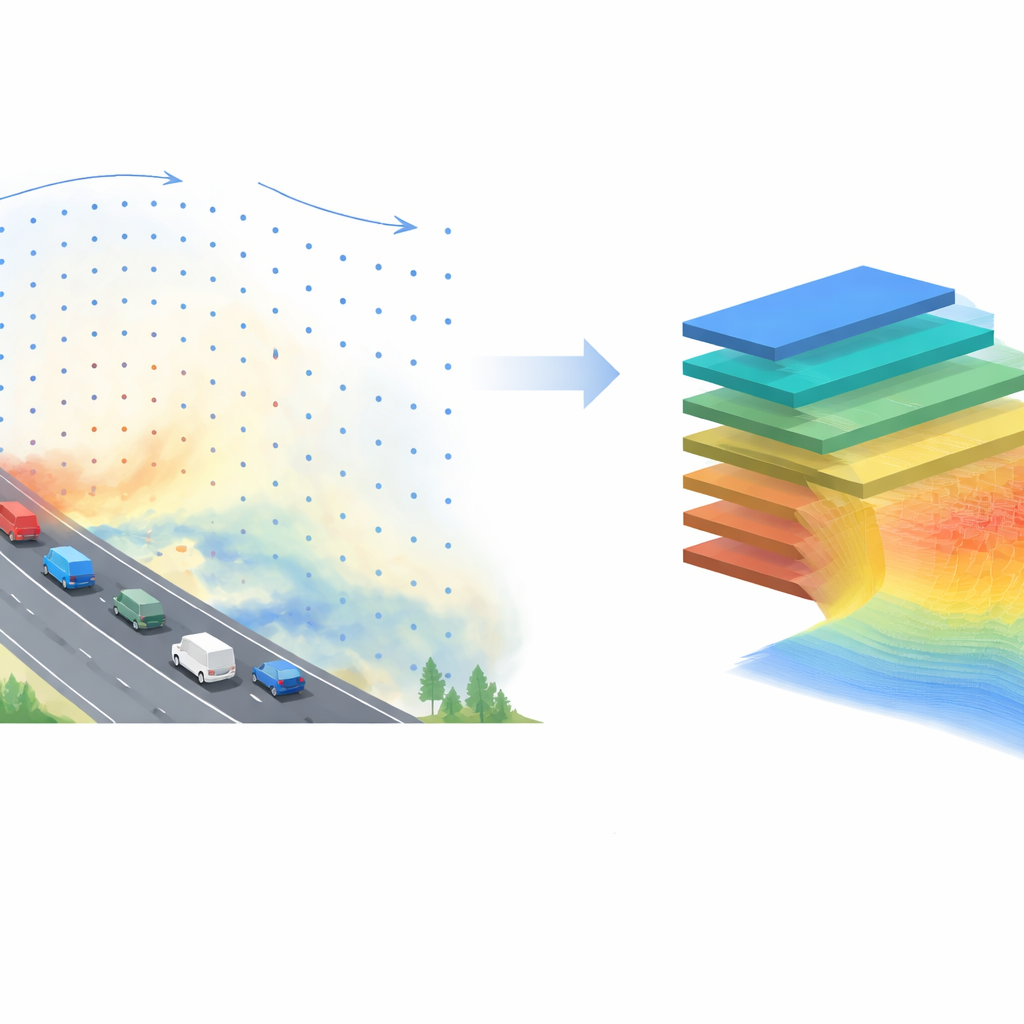
From scattered readings to a 3D pollution map
Because drones can only fly for a limited time and must follow safe paths, their measurements are patchy in space and time. To fill in the gaps, the team trained several machine-learning models to predict how pollution aloft compares with what is measured at the roadside. Instead of predicting raw concentrations, they focused on the ratio between drone readings and ground readings for each pollutant. The models used five groups of inputs: ground pollution levels, traffic volume and speed, weather (wind, temperature, humidity), the drone’s height and distance from the road, and season and time of day. Among several competing algorithms, a method called CatBoost performed best, explaining roughly two-thirds to nearly all of the variation in these ratios depending on the pollutant and season.
What drives pollution patterns above the street
By probing the trained model, the researchers could see which real-world factors most strongly shaped the vertical and horizontal patterns of each pollutant. For carbon monoxide, traffic speed mattered greatly: slower-moving or stop-and-go vehicles were linked to higher relative pollution near the road, reflecting more intense exhaust. For nitrogen dioxide and fine particles, the combination of what was happening at ground level and the local weather was key—warmer conditions and higher ground concentrations tended to boost levels aloft. Ozone patterns were governed more by meteorology and season than by ground ozone readings themselves, consistent with its formation by sunlight-driven chemistry. When the team used the model to create continuous maps of pollution ratios across height, distance, time, and season, the resulting patterns matched well with established understanding: higher nitrogen dioxide hugging the roadway, ozone building up through the day, and particles gradually mixing upward and away from the traffic lanes.
How this helps people breathe easier
In simple terms, the study shows that what a drone measures above a highway can be reliably reconstructed from what a ground monitor, traffic counters, and weather instruments observe below. By marrying short drone flights with machine learning, the researchers produced detailed three-dimensional views of roadside air quality that would be difficult and costly to obtain with measurements alone. These high-resolution maps can improve estimates of how strongly residents, commuters, and pedestrians are exposed to traffic pollution at different heights and distances, and at different times of day and year. In the long run, this combined drone-and-model approach could guide the placement of new roads, noise barriers, and green buffers, and help city officials test how traffic-control policies might clean the air people actually breathe.
Citation: Kho, C.J., Seo, S., Hwang, H. et al. Altitude-resolved prediction of roadside air pollution using UAV measurements and machine learning. Sci Rep 16, 13925 (2026). https://doi.org/10.1038/s41598-026-44153-9
Keywords: roadside air pollution, drones, machine learning, highways, fine particles