Clear Sky Science · en
Deep learning-based infrared thermography reveals reproducible uniform and individual thermoregulatory responses during running
Watching the Body Heat Up
When we go for a run, our bodies quietly juggle several jobs at once: moving muscles, delivering oxygen, and getting rid of excess heat. This study explores a new way to watch that juggling act in real time—by using thermal cameras and artificial intelligence to track how runners’ skin temperature changes during exercise. The work suggests that simple, contact-free heat images of the legs can reveal both common patterns shared by most runners and subtle, personal differences tied to performance capacity.
Taking Pictures of Heat While People Run
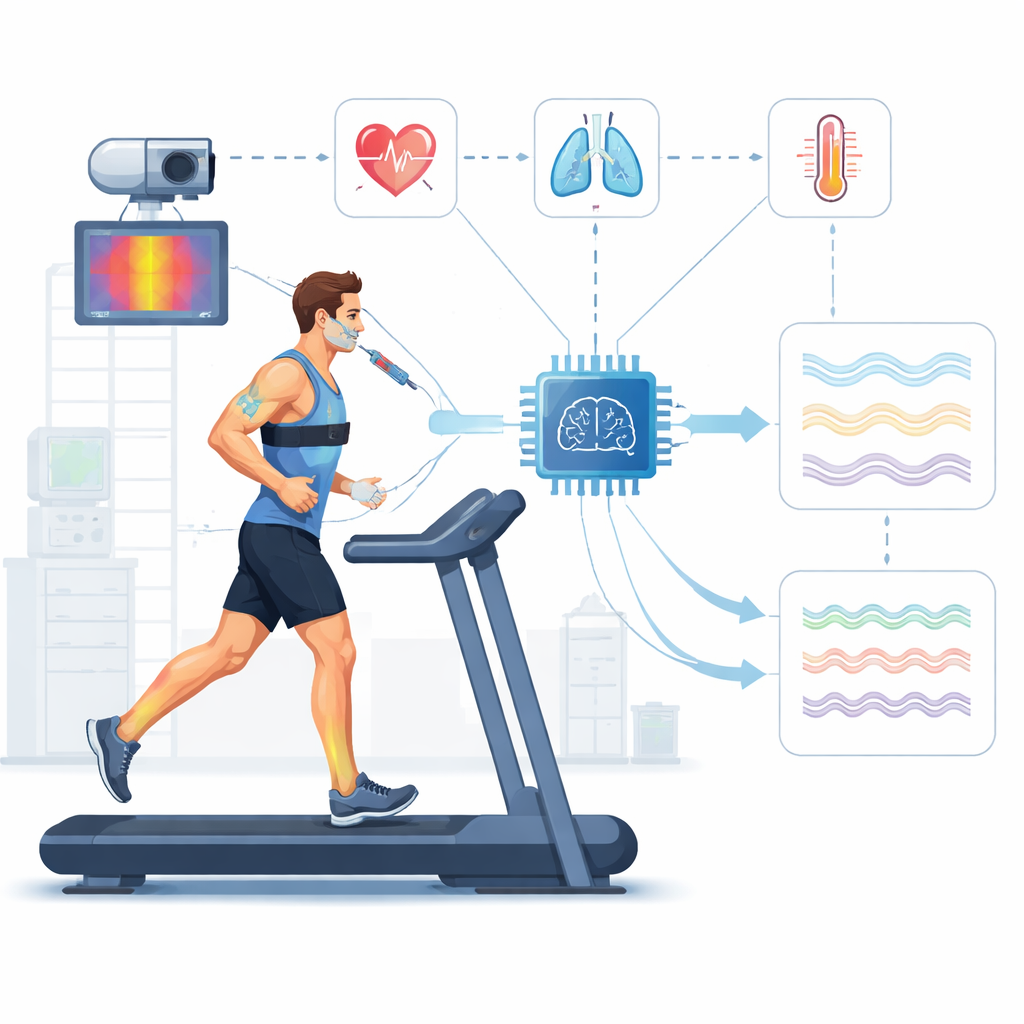
The researchers invited eleven healthy, endurance-trained young adults into a controlled laboratory. Each person completed three treadmill runs on two different days. The overall work in each run was the same, but the intensity patterns differed: one was steady, another switched from steady to intervals, and the third did the reverse. While participants ran, the team tracked heart rate, breathing, core body temperature (using internal and external sensors), perceived effort, sweat loss, and—crucially—heat patterns on the calves using a high‑resolution infrared camera placed behind the treadmill.
Letting Artificial Intelligence Read Thermal Maps
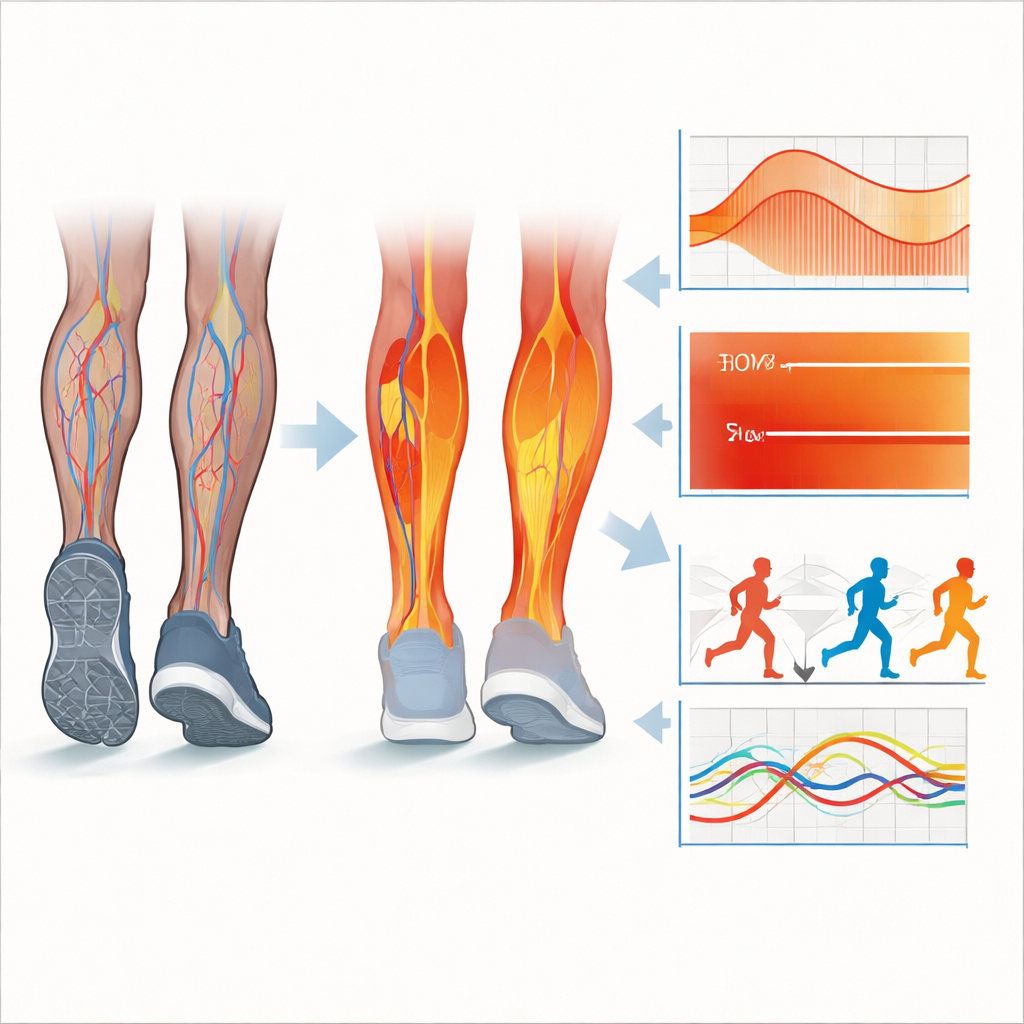
Instead of manually outlining regions on the thermal images, the team used deep learning—a form of artificial intelligence—to automatically recognize the calves and separate different types of blood-vessel regions. From each frame, the system calculated several skin temperature metrics: average calf temperature, temperature of areas without visible vessels, and temperatures over small arteries and superficial veins. It also measured “entropy,” a statistic that describes how varied the temperature patterns are across the skin surface. These measures were then synchronized with heart, breathing, and core temperature data, producing detailed time series across warm-up, main running phases, and recovery.
Shared Heat Patterns and Personal Signatures
Across all three runs, the various skin temperature measures rose and fell in step with changes in running intensity, even though their absolute values differed. Areas over small arterial vessels showed particularly strong links to heart rate and oxygen use, especially during high‑intensity intervals and recovery, suggesting they are sensitive markers of how hard the body is working and how quickly it sheds heat after effort stops. The entropy of these vessel regions tracked with core temperature during warm-up, reflecting how heat spreads across the skin as the body warms. At the same time, there were notable individual differences. In some runners—especially those with higher submaximal running capacity—the temperature of non‑vessel skin moved in the opposite direction of core temperature, creating larger gaps between deep body heat and cooler skin. These gaps likely reflect more effective blood‑flow adjustments that help offload heat while keeping core temperature in check.
Reliable Readings Across Different Days
A key question was whether these thermal measures are stable enough to be useful outside a single test. The study found that changes in non‑vessel skin temperature, particularly during warm-up, intervals, and recovery, were highly reproducible within the same person across all three runs, even when the order and pattern of the loads changed. Group-level patterns were also consistent. Less reliability appeared when comparing certain continuous running segments that were preceded by different types of effort, underlining that immediate exercise history can briefly reshape skin blood flow and temperature. Overall, however, the automated analysis delivered robust, repeatable signals under well‑controlled room conditions.
What This Means for Athletes and Health Monitoring
The findings show that smart analysis of heat images can capture both the shared ways humans regulate temperature during running and the personal twists linked to how well someone can sustain submaximal speeds. Deep learning turns a stream of thermal pictures into consistent numbers that line up with heart, breathing, and core temperature data. In the future, such non‑contact monitoring could help coaches and clinicians track internal load, spot early signs of overheating, or tailor training based on how efficiently a runner’s body moves heat—not just how high their peak fitness appears on paper.
Citation: Weber, V., López, D.A., Ochmann, D.T. et al. Deep learning-based infrared thermography reveals reproducible uniform and individual thermoregulatory responses during running. Sci Rep 16, 10525 (2026). https://doi.org/10.1038/s41598-026-44102-6
Keywords: infrared thermography, exercise physiology, deep learning, thermoregulation, running performance