Clear Sky Science · en
Spatially distributed wettability characterization in porous media
Why tiny fluid contacts matter for big energy questions
How do oil, water, and gases like hydrogen or carbon dioxide actually move and get trapped inside rocks deep underground? The answer hinges on “wettability” – how much the rock surface prefers one fluid over another – at scales far too small to see with the naked eye. This paper presents a new way to map that preference in three dimensions, pore by pore, revealing a hidden patchwork of behavior that strongly affects underground CO₂ storage, hydrogen storage, and oil recovery, as well as the performance of advanced batteries and fuel cells.
Looking inside rocks in three dimensions
Modern X‑ray micro–computed tomography (micro‑CT) lets scientists look inside small rock samples in 3D and see where different fluids sit in the pore space. From these images, they try to work out the “contact angle” where a fluid interface meets the solid surface, a simple geometric measure of wettability. In theory, this angle tells you whether the rock behaves as water‑loving, oil‑loving, or somewhere in between. In practice, reading that angle directly from images is extremely difficult: the exact line where rock, water, and oil meet is blurred over several pixels, surfaces are rough, and computerized “segmentation” of the phases is never perfect. Existing automated methods often smooth away important details, misplace interfaces by a few pixels, and therefore bias the angles, especially in complex rocks or mixed‑wet systems where behavior varies strongly from pore to pore. 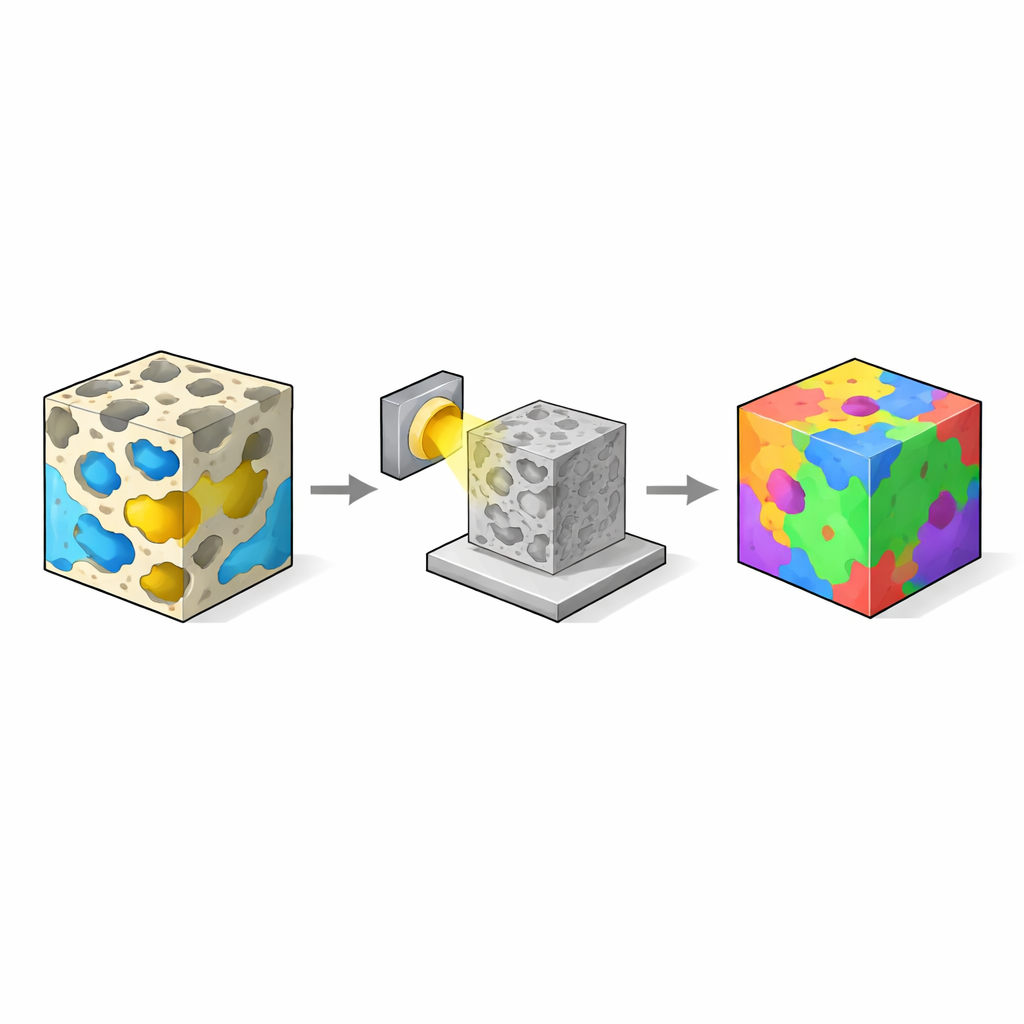
A new way to follow the fluid edges
The authors introduce an automated geometric algorithm that sidesteps the most troublesome part of the problem: pinpointing the exact three‑phase contact line. Instead of measuring precisely at this ambiguous line, the method builds detailed surface meshes of the rock–fluid and fluid–fluid boundaries and then extrapolates the local surface directions (normals) from neighboring, better‑resolved regions toward the contact. These normals are combined to compute contact angles at many points along each contact loop. The workflow includes careful noise reduction, a robust segmentation method that follows real intensity edges in the images, and gentle surface smoothing that removes pixelated “staircase” artifacts without shrinking or distorting the pore shapes. A built‑in quality check rejects outlier measurements that clearly conflict with the local neighborhood, trading quantity for reliability.
Testing the method on ideal shapes and real rocks
To check accuracy, the team first applied the algorithm to fully synthetic datasets: digital droplets resting on flat and curved solid surfaces where the true contact angle is exactly known. Across a wide range of angles and image resolutions, the new approach recovered the true values within about five degrees, performing better and more consistently than widely used existing tools, especially at low and high angles where errors usually grow. The researchers then moved to real micro‑CT images from several rock types, including limestones and sandstones, containing oil–water and hydrogen–water systems under flow conditions relevant to oil recovery and underground gas storage. By comparing automated results with painstaking manual angle measurements, they showed that their method closely matches human experts while avoiding the strong biases introduced by older automated techniques that over‑smooth the interfaces. 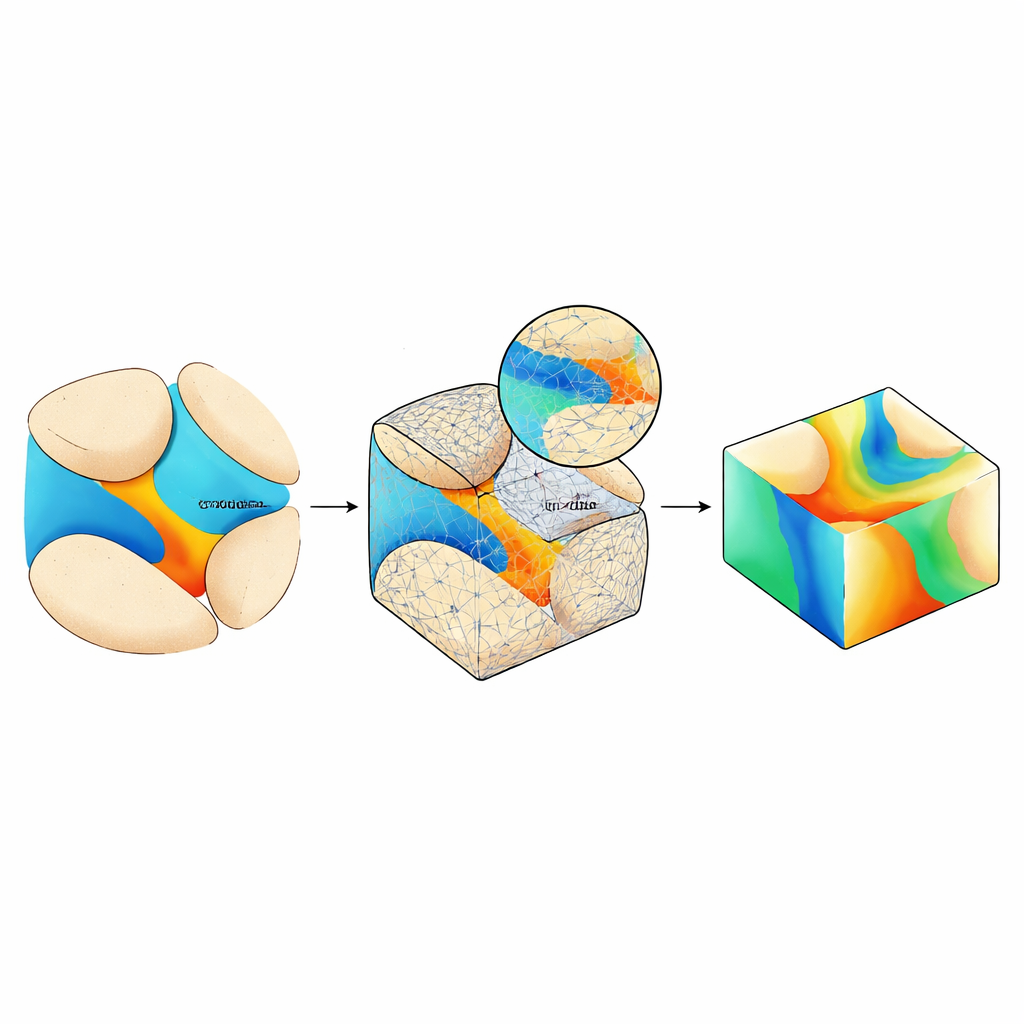
Revealing hidden patterns in rock–fluid behavior
Armed with thousands of reliable local measurements, the authors built 3D maps of contact angle throughout the pore space. In rocks that are overall water‑wet, the angles are relatively uniform and low, confirming that water tends to cling to the solid surfaces and flow through narrow corners while oil occupies the centers of pores. In a “mixed‑wet” sandstone, altered by long exposure to crude oil, the average angle suggests only mildly water‑wet behavior. However, the spatial map tells a richer story: nearly 60% of surfaces remain water‑wet, while about 40% shift into an intermediate regime where neither fluid is strongly favored. These intermediate patches are exactly where unusual saddle‑shaped interfaces and complex filling patterns are observed in the images, explaining puzzling combinations of trapping and flow that cannot be captured by a single, bulk average contact angle.
Why this matters for energy and the environment
For engineers trying to predict how CO₂ or hydrogen will spread and remain trapped underground, or how electrolytes and gases move through the porous layers of fuel cells and batteries, knowing a single “average” wettability is no longer enough. This study shows that subtle, spatially varying wetting behavior controls how fluids invade, get pinned, or bypass certain pathways. The new algorithm delivers pore‑by‑pore wettability maps, along with a transparent estimate of measurement uncertainty, in an open‑source software package. In accessible terms, it turns blurry X‑ray images of rocks into detailed “preference maps” for fluids, offering a powerful tool to design safer carbon storage projects, more stable hydrogen reservoirs, improved oil recovery strategies, and more efficient electrochemical devices.
Citation: Aljaberi, F., Belhaj, H., Foroughi, S. et al. Spatially distributed wettability characterization in porous media. Sci Rep 16, 12643 (2026). https://doi.org/10.1038/s41598-026-43688-1
Keywords: wettability, porous media, contact angle, CO2 storage, hydrogen storage