Clear Sky Science · en
Application of UAV photogrammetry technology in identifying discontinuities in slopes in the Pulang copper mine
Why flying robots watch mountain walls
High walls of rock above mines and mountain roads can fail without warning, sending tons of stone crashing downslope. Checking every crack in these cliffs by hand is slow and risky for engineers who must often work right beneath unstable rock. This study shows how camera‑equipped drones and smart data processing can safely “read” the hidden fracture patterns in a steep slope at China’s Pulang copper mine, helping predict where the rock is most likely to break.
Watching a dangerous slope from the sky
The Pulang copper mine sits in rugged, forested mountains in Yunnan Province, where deep excavation has carved a near 100‑meter cut into the hillside. Parts of the main slope are very steep and hard to reach, and rockfalls already occur during mining. The research team used a large drone with a high‑resolution camera to fly around the collapse pit and capture overlapping images of the cliffs. From these photos, they built a three‑dimensional digital model in the form of a “point cloud” — millions of tiny dots that together outline the shape of the rock surface. Because dense trees hide much of the rock, the team carefully removed vegetation points and chose a representative area where bare rock was exposed for detailed analysis. 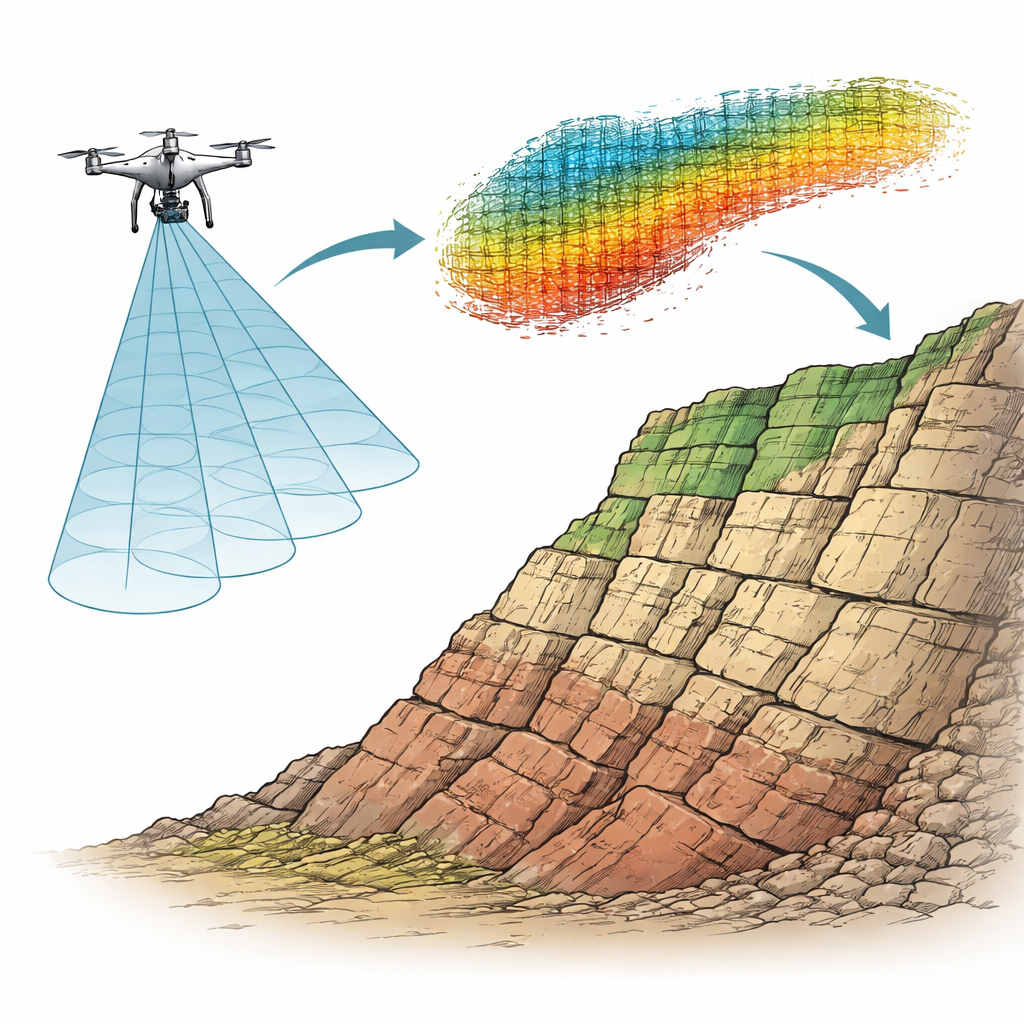
From raw dots to meaningful rock planes
Turning a raw cloud of dots into useful information about cracks is not straightforward. The authors combined several mathematical tools to do this efficiently. First, they used a method called principal component analysis to work out, for each point, how the surrounding rock surface is oriented and how much it curves. Points near the sharp lines where fractures intersect tend to have high curvature, so they filtered many of these away to simplify the data. They then applied a density‑based clustering technique that groups nearby points that lie on the same flat patch while marking isolated points as noise. This first pass splits the cloud into many small pieces that roughly follow individual fracture surfaces.
Grouping fracture families and measuring their size
Next, the team needed to sort these many pieces into a few main “families” of fractures that share similar directions. They did this by looking only at the orientations of each small patch, and feeding those into another clustering scheme that picks out groups with common trends. By applying this step to a reduced set of representative points instead of the full cloud, they kept computing time low while still capturing the main patterns. Finally, within each family, they ran a second round of density‑based clustering to recover complete individual fractures. For each one they estimated three key quantities: its tilt and compass direction, the length of its visible trace on the slope, and the spacing to its neighbors. Checks against careful manual fitting in specialist software showed that the automatic measurements of fracture directions stayed within a few degrees of expert estimates, good enough for engineering use.
Testing how fractures weaken the slope
The researchers then asked what these mapped fractures mean for slope safety. Using the measured directions, lengths, and spacings, they built a statistical model of a three‑dimensional fracture network inside the rock mass. They inserted this network into a computer simulation of the real slope, based on a surface fitted to the drone point cloud, and ran calculations of how the rock behaves under its own weight. Comparing a model with fractures to an otherwise identical unbroken slope, they found that the fractured version showed larger, less uniform movements and stronger concentrations of stress around the cracks. In other words, the fractures break the rock into blocks, channel forces along preferred paths, and create weak zones where failure is more likely to start. 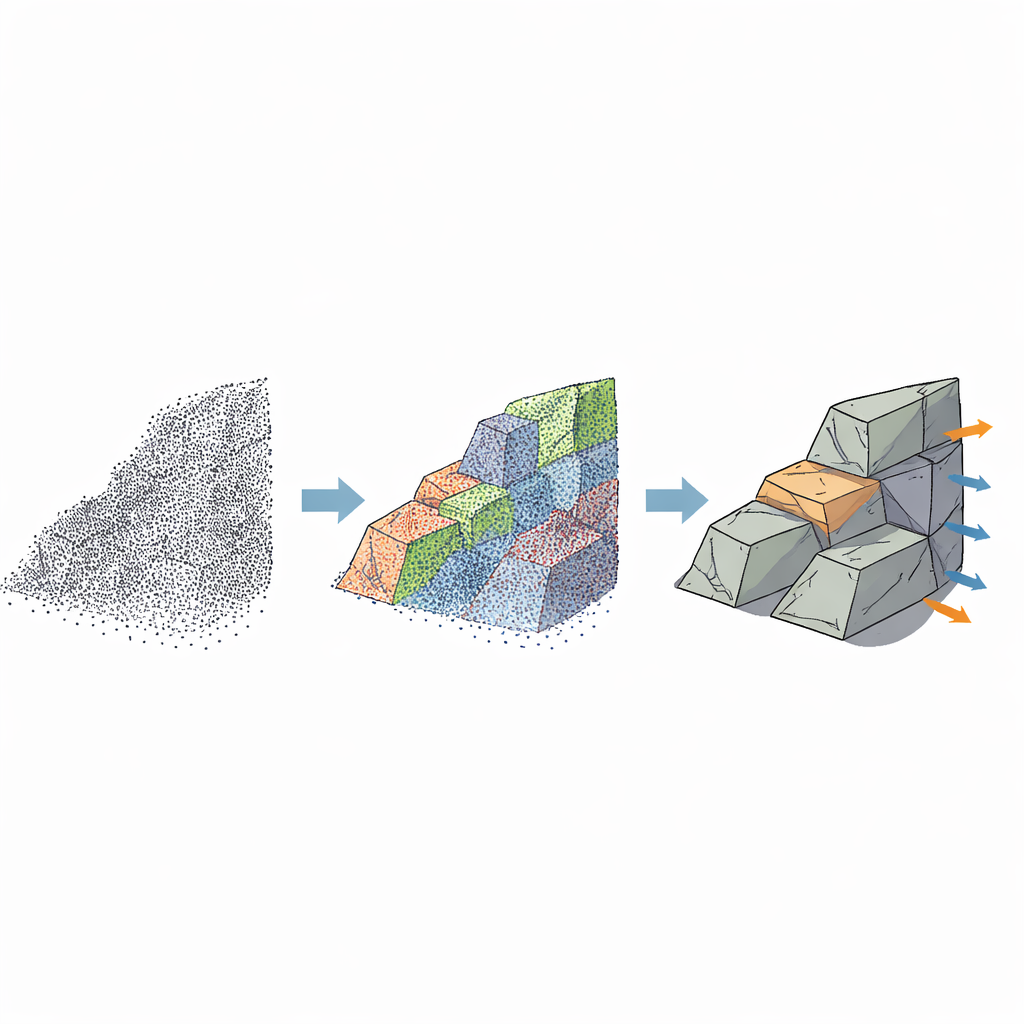
Faster digital eyes for safer slopes
For non‑specialists, the central message is that drones plus clever data crunching can now survey dangerous cliffs quickly, with no one standing in harm’s way, and still reveal the subtle crack patterns that control future collapses. The Pulang case shows that the new method can process very large datasets far faster than older approaches while delivering fracture measurements accurate enough to feed into stability simulations. Although thick vegetation and some simplifying assumptions still limit what can be seen, this workflow points toward routine, repeatable health checks for rock slopes above mines, highways, and dams—using flying robots and math to spot trouble before gravity does.
Citation: Wu, L., Wang, Y., Yang, J. et al. Application of UAV photogrammetry technology in identifying discontinuities in slopes in the Pulang copper mine. Sci Rep 16, 14101 (2026). https://doi.org/10.1038/s41598-026-43520-w
Keywords: drone mapping, rock slope stability, 3D point cloud, mine safety, fracture detection