Clear Sky Science · en
Automated analysis of zebrafish vascular networks using the VISTA-Z pipeline
Why tiny fish blood vessels matter
Heart and blood vessel disease is the leading killer worldwide, yet many of the early changes in our vessels are hard to see and measure. Zebrafish embryos, which are small, transparent, and share many genes with humans, let scientists watch blood vessels form in real time. This study introduces VISTA-Z, a computer pipeline that automatically turns fluorescent microscope pictures of zebrafish vessels into precise measurements, helping researchers spot subtle changes linked to genes, drugs, or disease-like conditions.
Turning pictures into measurements
Modern microscopes can capture stunning images of the fine web of vessels in a zebrafish, but scientists usually analyse these pictures by hand, drawing outlines and counting branches one by one. That is slow, tiring, and can vary from person to person. VISTA-Z replaces this with an automated sequence of steps that clean up the image, pick out the vessel shapes, and turn the network into simple lines that can be measured. The software adjusts contrast, separates vessels from background, highlights tube-like structures, and removes obvious artefacts, all with minimal user input. 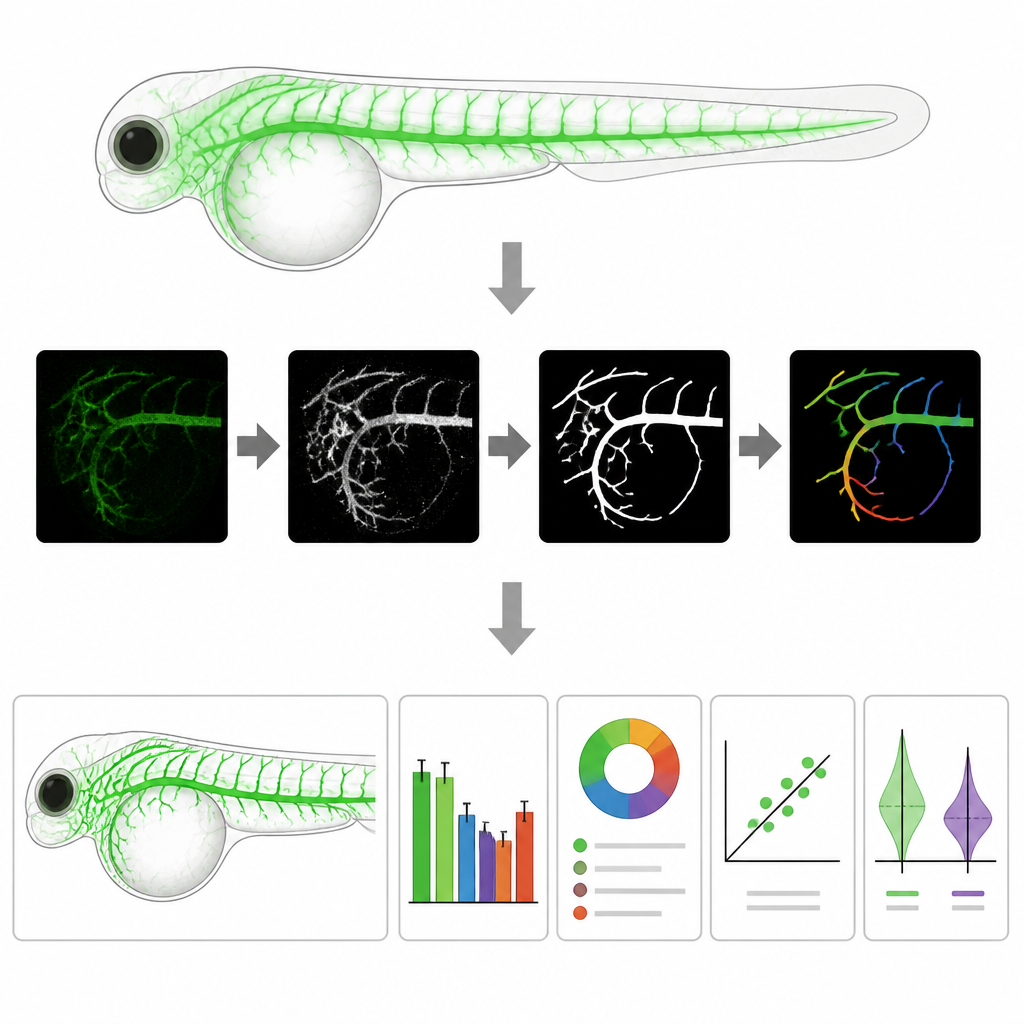
Checking reliability across different views
To test whether VISTA-Z works in many situations, the authors fed it images from zebrafish lines that label blood vessel cells in different ways and at different ages. They examined both the brain and the trunk from three to five days after fertilisation, when the vascular network becomes more complex. Across these tests, the pipeline produced consistent measures of vessel length, density, and branch number, while revealing that apparent vessel thickness depends strongly on which fluorescent marker is used. This warning is important for the field, because it shows that some readouts are sensitive to the choice of reporter, whereas others are more robust. The team also used built-in tools to focus on specific regions of interest, such as left versus right brain, or front versus back trunk, confirming that the method can zoom in on local patterns without losing reliability.
Following growth of the vessel network
Because VISTA-Z can process many images quickly, it is well suited to track how the vascular network expands over time. The authors quantified vessel development in normal zebrafish from three to five days. In both brain and trunk, total vessel length and density rose steadily, and the number of branch points increased, especially in the trunk. In contrast, average vessel width barely changed. These results suggest that, during this window, growth is driven mainly by adding and extending thin vessels rather than by widening existing ones. Such baseline maps are crucial: they provide a reference pattern of healthy growth against which disease models or drug treatments can be compared. 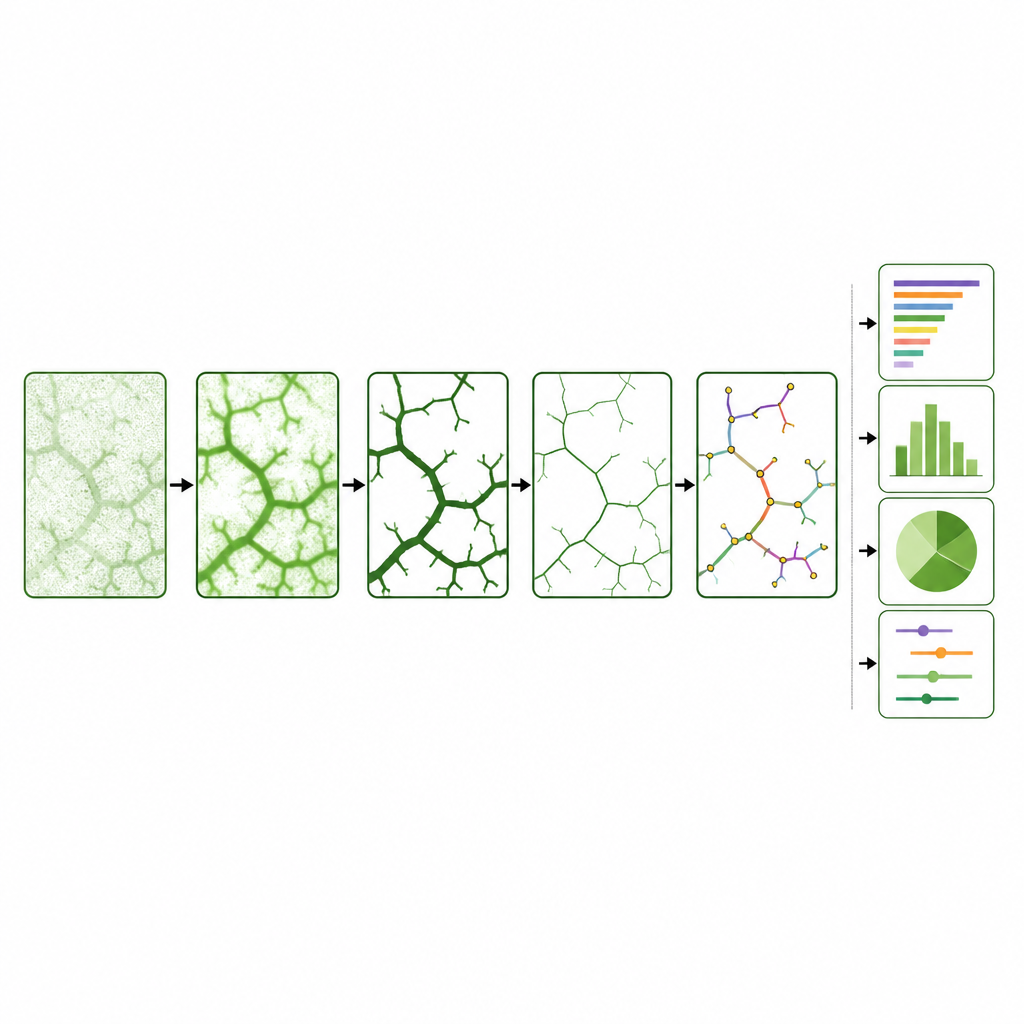
Spotting vessel loss and vessel overgrowth
The authors then asked whether VISTA-Z could detect disease-like changes caused by gene mutations. In fish lacking a gene called foxc1a, which in people is linked to small vessel disease and stroke, the pipeline revealed missing brain arteries, shorter networks, fewer branches, and thicker remaining vessels. In fish with faulty kdrl, a key vessel growth receptor, it showed severe loss of both brain and trunk vessels and altered regional patterns, with some areas affected more than others. Finally, in fish with reduced activity of the plxnd1 gene, which normally restrains sprouting, VISTA-Z captured widespread vessel overgrowth, denser networks, and many extra branches, especially in the trunk and in normally low-vessel regions. These tests demonstrate that the pipeline can quantify both vessel loss and overgrowth across the body.
What this means for future research
By turning complex images of tiny fish vessels into standardised measurements, VISTA-Z gives researchers a powerful, shared language to describe how blood vessel networks grow, shrink, and remodel. The study shows that the pipeline is robust across different fluorescent markers, stages of development, and genetic backgrounds, and that it can uncover patterns that might be missed by the human eye. For a lay observer, the key message is that smarter image analysis in simple animal models can speed up the search for genes and treatments that shape our blood vessels, ultimately improving our understanding of conditions such as stroke and cardiovascular disease.
Citation: Rodriguez-Pastrana, I., Richens, J. & Wilkinson, R.N. Automated analysis of zebrafish vascular networks using the VISTA-Z pipeline. Sci Rep 16, 15611 (2026). https://doi.org/10.1038/s41598-026-43301-5
Keywords: zebrafish, angiogenesis, vascular imaging, image analysis, vessel segmentation