Clear Sky Science · en
Probabilistic 3D lithology classification from elastic property volumes an advanced inversion workflow at Desouq Gas Field, West Nile Delta, Egypt
Finding Hidden Gas Beneath the Nile Delta
Locating new gas reservoirs is becoming harder as the easiest targets are already tapped. In Egypt’s onshore Nile Delta, rock layers are complex and traditional seismic images can easily be fooled, leading companies to drill expensive dry or low‑yield wells. This study presents a new way to "see" underground: it combines advanced seismic processing, rock property analysis, and probabilistic machine learning to build a 3D picture of which rocks likely hold gas and which are tight or water‑filled, helping reduce exploration risk and wasted drilling.
A Challenging Subsurface Puzzle
The Desouq Gas Field sits in a geologically intricate part of the West Nile Delta, where faults, channels, and shifting sea levels have stacked sands, shales, and evaporite rocks in tangled patterns. Gas is mainly trapped in sand channels of the Abu Madi Formation, but a particular troublemaker is anhydrite, a very dense, tight rock. Thin anhydrite layers can create strong seismic reflections that look much like gas‑bearing sands. Earlier approaches mostly relied on simpler seismic products and amplitude maps, which could not reliably distinguish these look‑alike signals, leaving companies unsure whether a bright seismic patch was a promising gas target or just a tight, non‑productive bed.
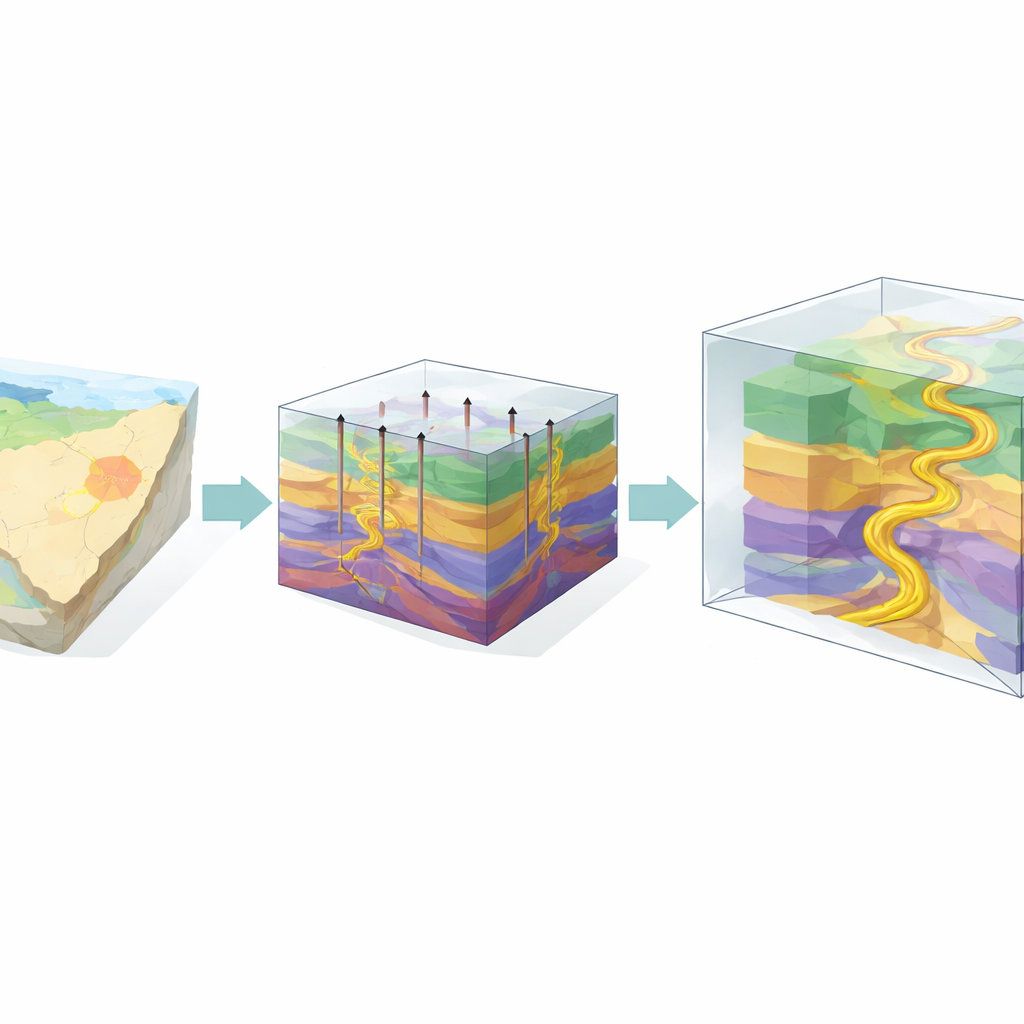
Turning Seismic Echoes into Rock Types
To tackle this, the authors built a two‑stage workflow. First, they used pre‑stack seismic inversion, which analyzes how seismic reflections change with angle to estimate key underground properties such as P‑impedance, shear impedance, and the ratio of compressional to shear wave speeds. These properties were calibrated with measurements from five wells, where detailed logs show how gamma rays, density, sonic velocities, and other indicators vary through the rock column. Careful quality checks ensured that the inverted property volumes matched the well data and followed the known geological layering, creating a reliable starting model of the subsurface.
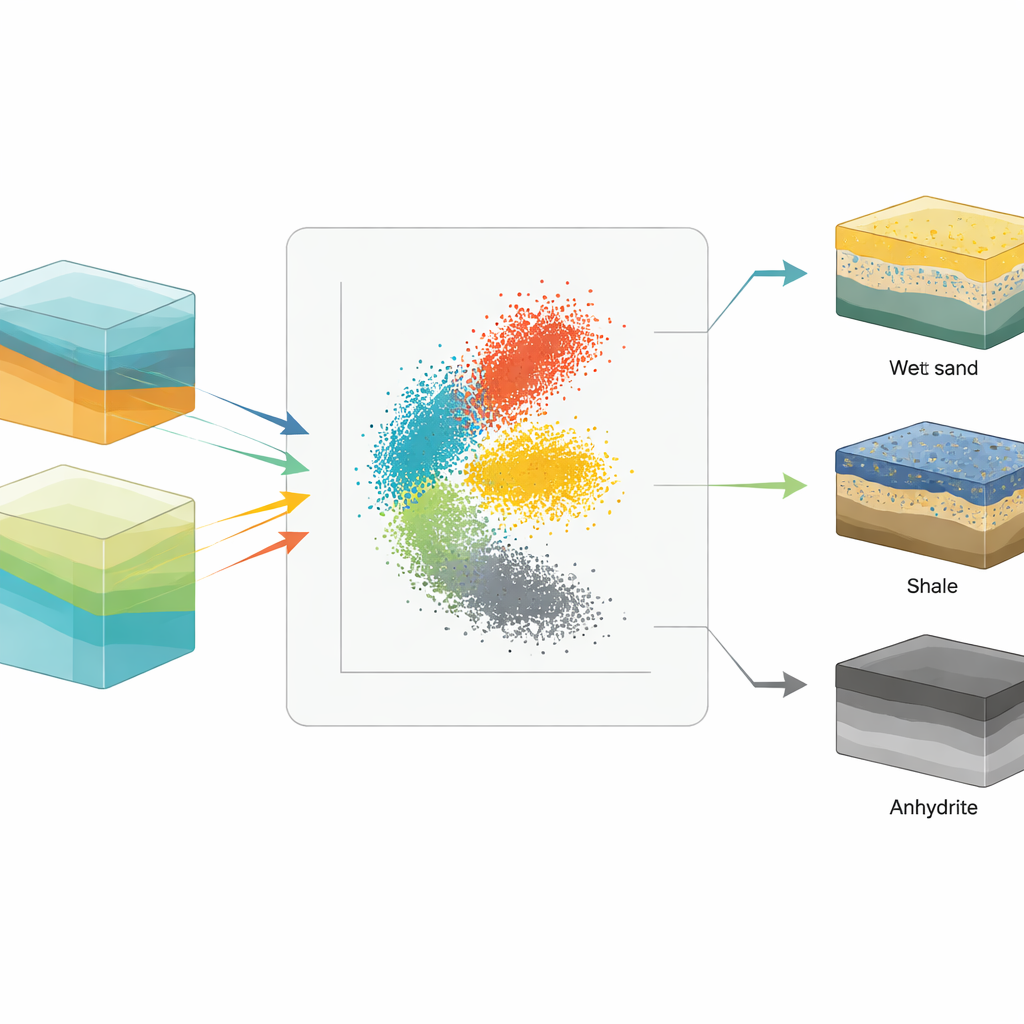
Teaching the Computer to Recognize Rocks
The second stage turned these calibrated properties into a statistical rock‑type model. At the well locations, the team performed petrophysical analysis to identify which depths contained gas‑bearing sand, wet sand, shale, or tight anhydrite. They then used rock physics cross‑plots to see how these rock types cluster in terms of impedance and velocity ratios. From these clusters, they built probability density functions—essentially fingerprints describing how likely a given combination of properties is to belong to each rock type. A machine‑learning classifier trained on this labeled well data was then applied across the entire 3D seismic volume, producing "probability cubes" that, for every point underground, estimate the chances of it being gas sand, wet sand, shale, or anhydrite.
What the New 3D View Reveals
The resulting probabilistic maps show compartmentalized channels of gas‑charged sand weaving through the Abu Madi Formation. Importantly, they refine earlier interpretations by separating true gas signatures from misleading bright spots caused by thin anhydrite layers. Confusion‑matrix statistics indicate that the model identifies gas sands with high accuracy, while misclassification of anhydrite is very low. When the probability cubes are compared with seismic sections and well logs, zones of high gas‑sand probability line up with intervals of low water saturation, giving operators more confidence in where gas actually resides. The analysis also uncovers eight additional gas‑bearing zones in the southwest part of the field that had previously been written off or left uncertain.
Why This Matters for Future Exploration
In everyday terms, this study upgrades the industry’s underground "eyes" from a fuzzy black‑and‑white picture to a color‑coded 3D map of likely rock and fluid types. By combining advanced seismic inversion, rock physics, and probabilistic classification, the workflow cuts down on false leads caused by deceptive tight rocks and better outlines where gas‑rich sands are connected or compartmentalized. Although some uncertainties remain—especially where gas and water‑filled sands look similar or where layers are thinner than seismic resolution—this integrated method offers a more reliable guide for choosing drilling locations and planning field development, in the Nile Delta and in other complex basins worldwide.
Citation: El Hateel, M.S., El Sayed, A.A., El-Werr, AK. et al. Probabilistic 3D lithology classification from elastic property volumes an advanced inversion workflow at Desouq Gas Field, West Nile Delta, Egypt. Sci Rep 16, 10950 (2026). https://doi.org/10.1038/s41598-026-42888-z
Keywords: Nile Delta gas, seismic inversion, lithology classification, probabilistic reservoir modeling, rock physics