Clear Sky Science · en
Structural fatigue failure analysis and lifetime reliability monitoring strategy of the lattice jib in all-terrain cranes
Why crane arms can quietly wear out
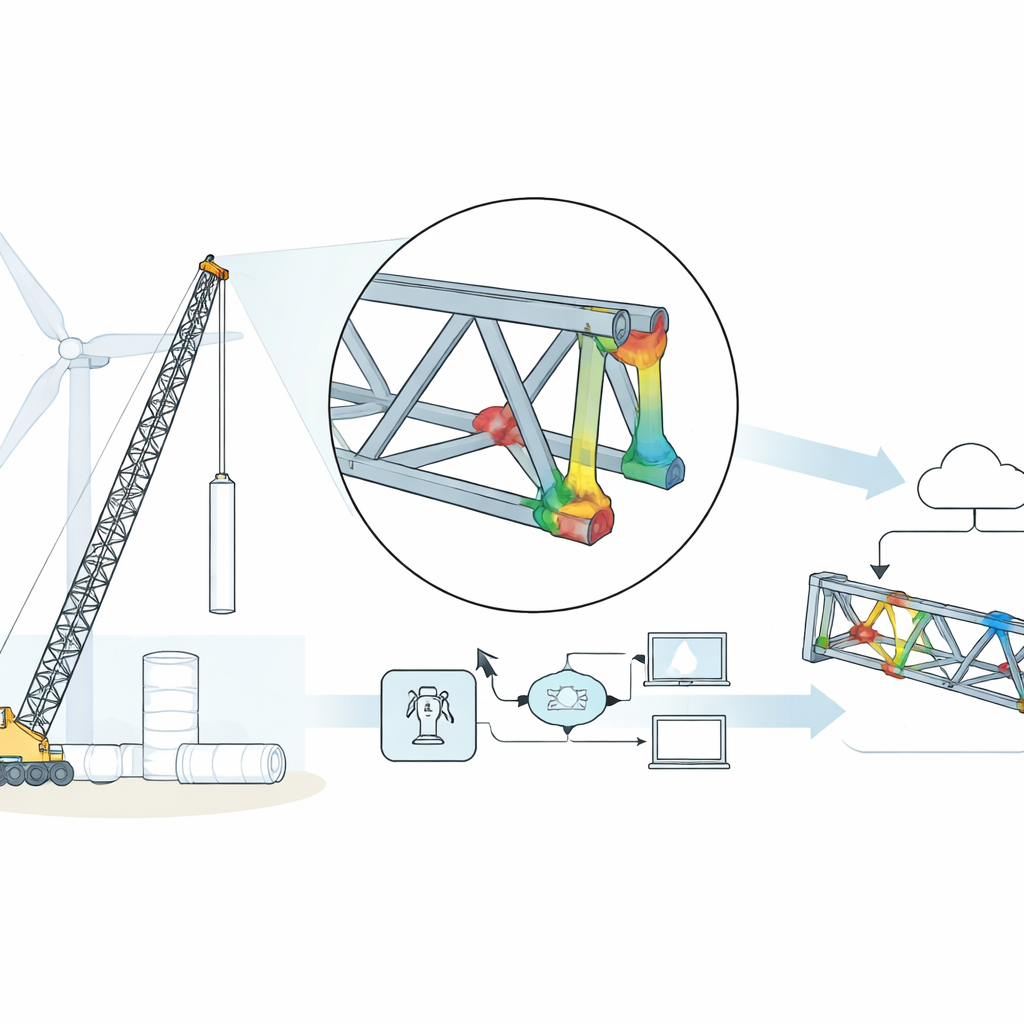
Across the world, giant mobile cranes are racing to erect wind turbines and other heavy structures. While their steel arms look solid and unchanging, every lift flexes and relaxes the metal, slowly weakening it in much the same way a paper clip snaps if you bend it back and forth often enough. This paper explores how and where that hidden damage builds up in the open-framework "lattice" extensions on crane booms, and shows how live data from sensors and digital models can warn engineers before a crack turns into a serious accident.
The metal skeleton at the end of the boom
The study focuses on the lattice jib, the truss-like steel section added to the tip of a crane’s telescopic boom to reach higher and farther—vital for lifting wind turbine parts. Each jib is built from hollow steel tubes (chords and braces) welded together. As a crane repeatedly lifts, slews, and lowers heavy loads in the wind, these welded areas endure alternating push–pull forces. Modern design trends toward lighter structures make the tubes thinner and add more cutouts, which improves efficiency but also increases flexibility and concentrates stress at welds. Because these welds are small and tightly packed, and cracks are hard to spot before they cut all the way through, traditional rule-of-thumb safety margins are no longer enough.
From full-scale tests to tiny crack marks
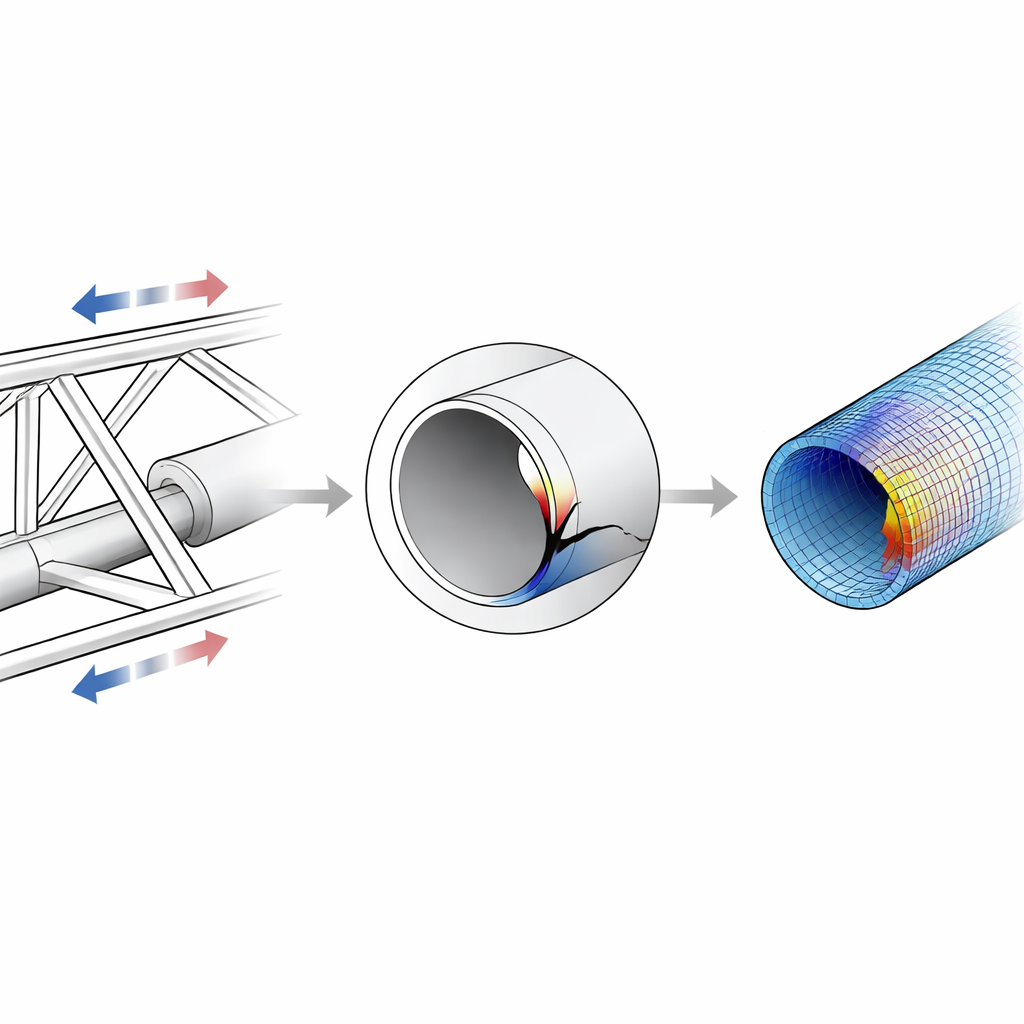
To see how damage really develops, the researchers built a full-sized test rig using a six-meter-long section of lattice jib made of high-strength S890 steel. They first applied steadily increasing loads and measured how the steel stretched at many points along the chords near the fixed end, where the jib meets the rest of the boom. Then they ran fatigue tests, cycling the load up and down once per second until the steel failed. All three test pieces cracked at essentially the same place: the outer edge of a weld where a brace meets a main tube under repeated tension. After the tests, they cut open the failed regions and used microscopes to study the fracture surfaces. Under high magnification they observed classic “striations,” tiny parallel ripples that mark the advance of the crack with each load cycle. By measuring the spacing of these ripples along the crack path, they could estimate how many cycles the crack had spent growing through the tube wall, and compare that with the number recorded in the fatigue tests.
Building a digital twin of the welded joints
The team then recreated the tested jib section in a three-dimensional computer model using solid elements fine enough to represent the actual weld geometry. They paid special attention to the so‑called “hot spots” at the weld toes, drawing virtual lines through the tube wall to calculate how stress varied from the surface inward. By adjusting the mesh size and how deep into the wall the stress was averaged—parameters chosen to match real weld size and depth—they tuned the model until its predicted fatigue lives were within about ten percent of the test results. The model not only reproduced the location of failure but also indicated which of the 80 or so welds in the section were most vulnerable. This showed that, with suitable detail around critical welds, simulation can reliably stand in for many expensive physical fatigue tests.
Letting the crane tell its own story in real time
Knowing how a single jib segment behaves under a fixed load is only half the challenge; real cranes see constantly changing conditions on site. To capture this complexity, the authors turned to the crane’s onboard sensors, which continuously log information such as boom length, jib length, working angle, direction, load weight, and engine status. Over months, this can amount to hundreds of thousands of data points. The researchers devised rules to sift through this stream and extract distinct lifting cycles: intervals where the load rises from the hook’s own weight above a set threshold and then returns. For each such cycle, they recorded the peak load and posture of the crane. These processed records fed a simplified computer model of the entire boom, which translated each operating condition into the forces and bending moments acting at the joints of every lattice section. Those force histories were then applied to the refined solid model of a representative jib segment to build a realistic “load spectrum” and calculate how much fatigue damage accumulated at each weld over the crane’s working life.
What this means for safer lifting
In plain terms, the study shows that it is now possible to give a crane something like a health meter for its steel arm. By combining well‑designed lab tests, detailed models of welded joints, and real‑time operating data sent through the Internet of Things, engineers can pinpoint which welds in the lattice jib are aging fastest, how close they are to their fatigue limit, and when targeted inspections or repairs are needed. Instead of relying on conservative schedules or waiting for cracks to be noticed by eye, crane owners could track fatigue in service, extend the safe life of healthy components, and intervene early where the risk is highest—improving both safety and efficiency on demanding construction projects.
Citation: Yao, J., Fu, Y., Li, C. et al. Structural fatigue failure analysis and lifetime reliability monitoring strategy of the lattice jib in all-terrain cranes. Sci Rep 16, 12403 (2026). https://doi.org/10.1038/s41598-026-42707-5
Keywords: all-terrain crane fatigue, lattice jib welds, structural health monitoring, finite element fatigue analysis, IoT crane data