Clear Sky Science · en
Simulation-based optimization analysis of passenger flow organization in metro interchange stations using AnyLogic
Why crowded stations matter
Anyone who has hurried through a packed subway station knows how stressful crowds can be. Lines at ticket machines, bottlenecks at fare gates, and clashing streams of people can slow everyone down and raise safety concerns. This study looks at a busy transfer station where intercity train passengers pour directly into the metro, and asks a simple but powerful question: by carefully redesigning routes, gates, and signs, how much smoother and safer can we make the daily rush?
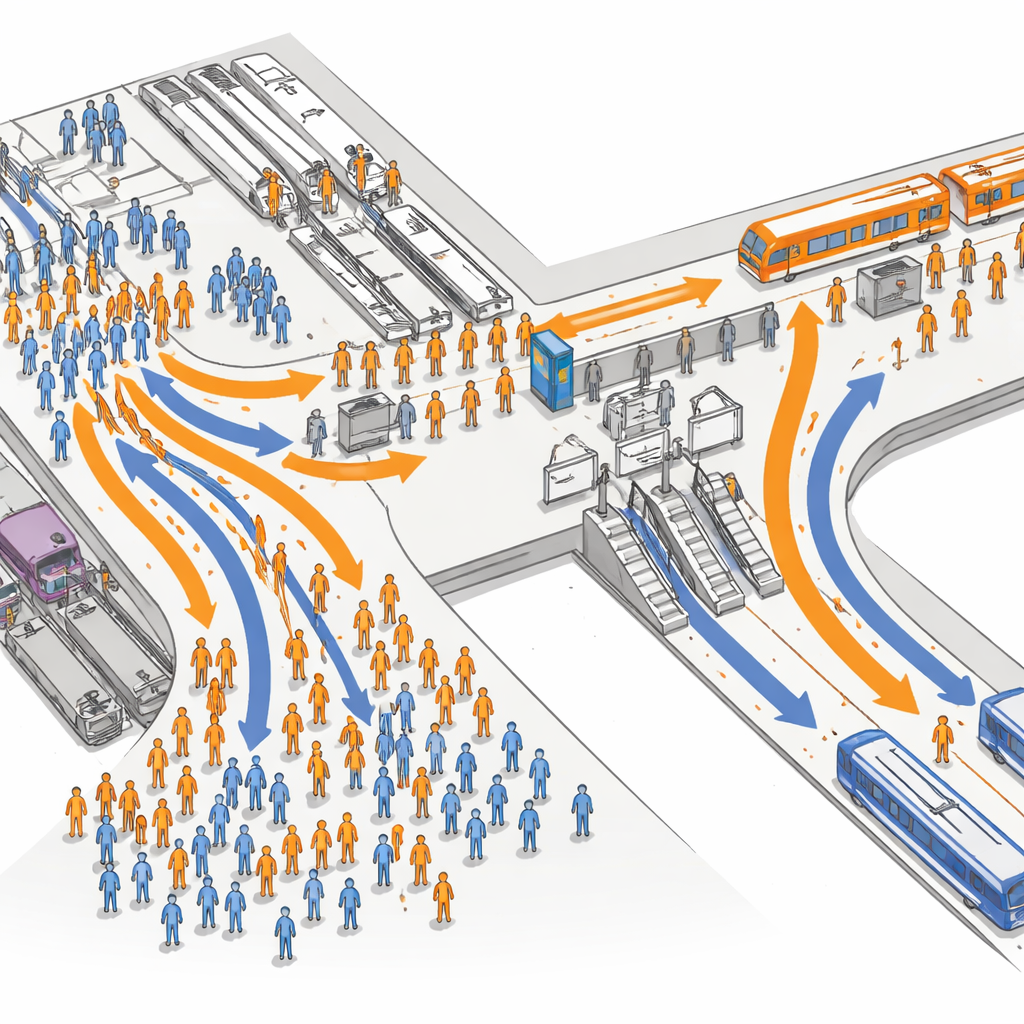
A closer look at a busy transfer hub
The researchers focus on Station S in a large Chinese city, where the metro connects directly to the main railway station. During peak periods, about 4,000 people per hour enter the metro, most of them arriving from high-speed trains and many pulling luggage. Because the main exit from the railway platforms opens near a single cluster of ticket machines and entry gates, newcomers instinctively flock to that area. At the same time, other passengers are leaving the metro or transferring between two metro lines. The result is a narrow zone where people heading in different directions cross each other’s paths and quickly generate jams.
Building a digital twin of the crowd
Instead of experimenting directly on real commuters, the team creates a detailed computer simulation of the station using specialized software called AnyLogic. Each virtual pedestrian behaves like an individual, choosing routes, accelerating or slowing down, and steering around others based on a "social force" idea: people are pulled toward their goals, repelled from collisions, and subtly attracted to key features such as exits or escalators. The model incorporates real measurements, including how fast people with and without luggage tend to walk, how long ticket purchases take, and how quickly gates and escalators can process riders. With this digital twin, the researchers can replay the rush hour and see exactly where long queues and high-density clusters appear.
Finding the choke points
Running the simulation for a typical peak hour confirms what on-site observations suggested. One set of ticket machines and one group of entry gates near the railway exit are overwhelmed, showing very high passenger densities and long queues. By contrast, other gates and machines farther away sit underused. Guidance signs currently encourage most people—especially the roughly 88% who are unfamiliar with the layout—to use the closest gate group. About 28% of passengers also choose to buy paper tickets at the nearest machines rather than scan a code, further intensifying the crush in this small area. This imbalance wastes valuable floor space and slows everyone down.
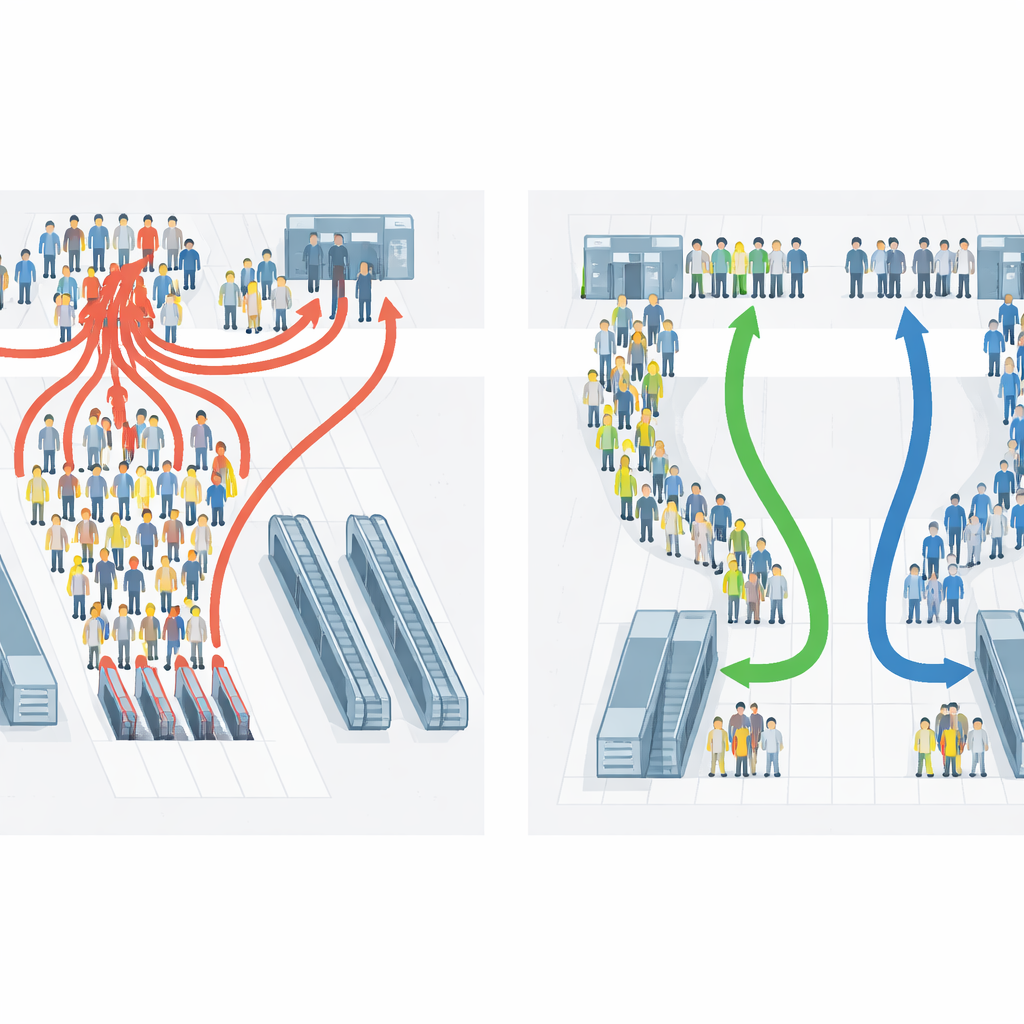
Redesigning paths, gates, and signs
To fix these problems, the researchers test a combined strategy. First, they reconfigure the physical facilities: several underused exit gates are converted into a new set of entry gates on the opposite side of the hall, and a previously idle group of ticket machines is activated. Second, they rethink wayfinding. New overhead and freestanding signs are placed at key corners and junctions to gently separate passengers by destination, steering those heading to different metro lines toward different gates and machines. The messages are kept simple, reflecting how people remember only a handful of pieces of information at a glance. In the simulation, most passengers follow the signs, while a minority still choose their usual shortest routes, mimicking real behavior.
How much improvement is possible?
When the team compares several scenarios—changing only facilities, changing only signs, and changing both together—the combined approach wins clearly. Maximum crowd densities at the worst bottlenecks fall by around 40–60%, queue lengths at the busiest ticket machines and entry gates shrink sharply, and the average time it takes inbound passengers to reach their platforms drops by about a quarter. Importantly, service quality at the most congested points improves from "worst case" to a more acceptable level, even though one exit area becomes slightly busier as flows are redistributed. The station as a whole functions more smoothly, with clearer streams and fewer conflict points.
What this means for everyday riders
For the everyday commuter, the takeaway is encouraging: major gains in comfort and safety do not always require expensive construction or new technology. By combining smarter placement of gates and ticket machines with well-designed, easy-to-follow signs, transit agencies can turn chaotic crowds into orderly streams, cutting walking and waiting times while using existing space more effectively. The study shows that such changes can be evaluated and fine-tuned in advance using realistic crowd simulations, offering city planners a practical toolkit for keeping growing metro systems moving.
Citation: Tian, Y., Jin, G., Lu, S. et al. Simulation-based optimization analysis of passenger flow organization in metro interchange stations using AnyLogic. Sci Rep 16, 12517 (2026). https://doi.org/10.1038/s41598-026-41719-5
Keywords: metro crowding, passenger flow, station design, wayfinding signage, pedestrian simulation