Clear Sky Science · en
High resolution mapping of protein motions in time and space with RMSX and Flipbook
Watching Proteins in Motion
Proteins inside our cells are not rigid sculptures; they twist, bend, and breathe as they do their jobs. Many essential biological processes—from how viruses mature to how bacteria cling to our tissues—depend on exactly when and where parts of a protein move. Yet most computer tools either show the average motion over time or the overall change in shape, making it hard to pinpoint short-lived, local movements. This article presents two new methods, called RMSX and Flipbook, that turn complex simulation data into clear, detailed pictures of protein motion in both time and space, making it easier for scientists to spot important molecular events and explain them to others.
A New Way to Track Wiggling Parts
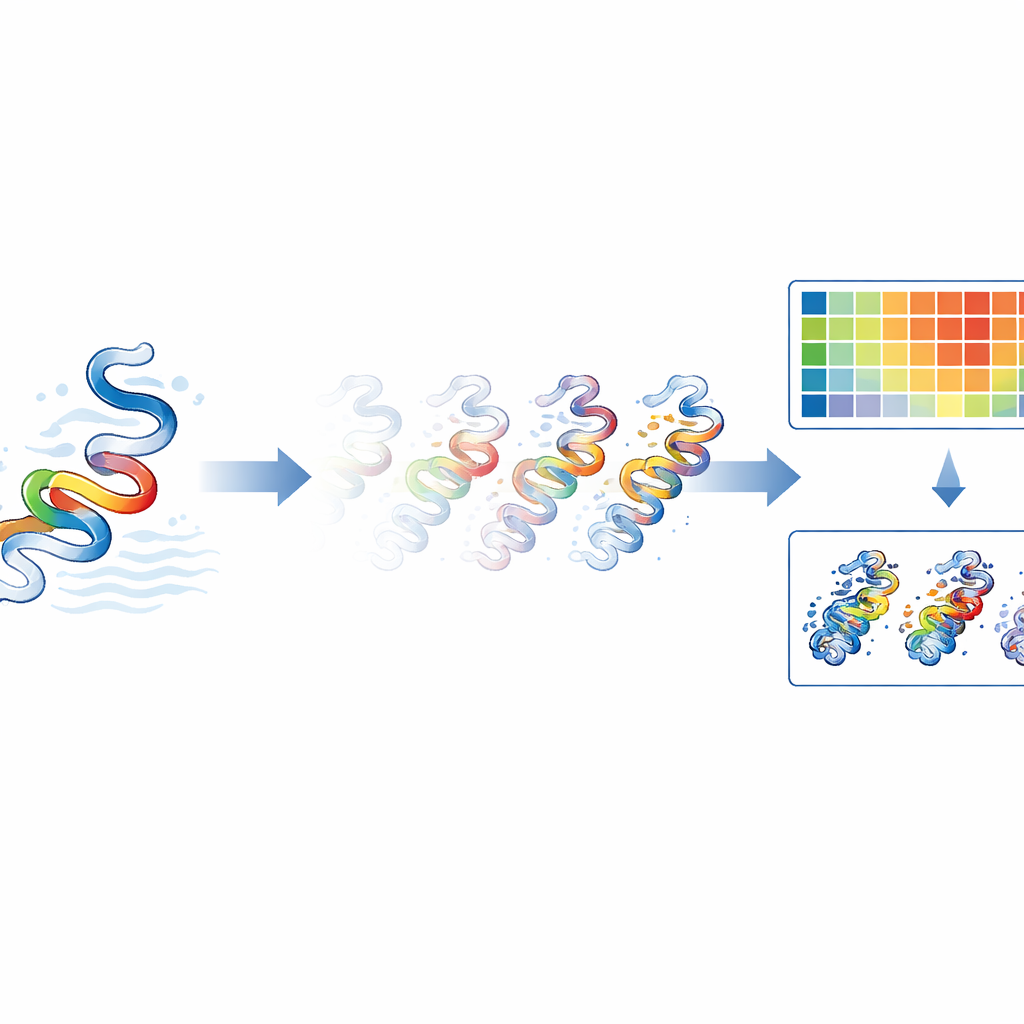
Traditional measures used in molecular simulations, such as root mean square deviation (RMSD) and root mean square fluctuation (RMSF), give only part of the story. RMSD tells how far a protein’s overall shape drifts from its starting form, while RMSF describes how much each amino acid moves on average during the entire simulation. Neither one can say, for a specific residue, both how much it moves and exactly when that movement happens. RMSX solves this by slicing a simulation into time windows and calculating per-residue motion within each slice. The results are assembled into a heatmap in which one axis represents protein position, the other represents time, and the colors reveal how strongly each part of the protein fluctuates at each moment. This simple rearrangement of familiar calculations gives a high-resolution view of shifting protein regions that might otherwise be missed.
Turning Numbers into Moving Pictures
While RMSX produces rich numerical data, scientists still need to see these motions on the actual 3D structure. Flipbook is designed to do precisely that. It takes values such as RMSX or other per-residue measures and encodes them into standard protein structure files in a way that popular molecular viewers understand. When these snapshots are loaded into tools like ChimeraX or VMD, each amino acid can be colored and thickened according to its motion, and the snapshots are laid out in sequence like frames of a cartoon. The result is a visual “flipbook” that lets viewers follow how specific loops or segments sway, stretch, or stay rigid over time. Because the same color scales are used for the heatmaps and the 3D views, it is straightforward to connect a bright patch in a plot to the exact region of the protein that is misbehaving or springing into action.
Testing the Tools on Real Molecular Stories
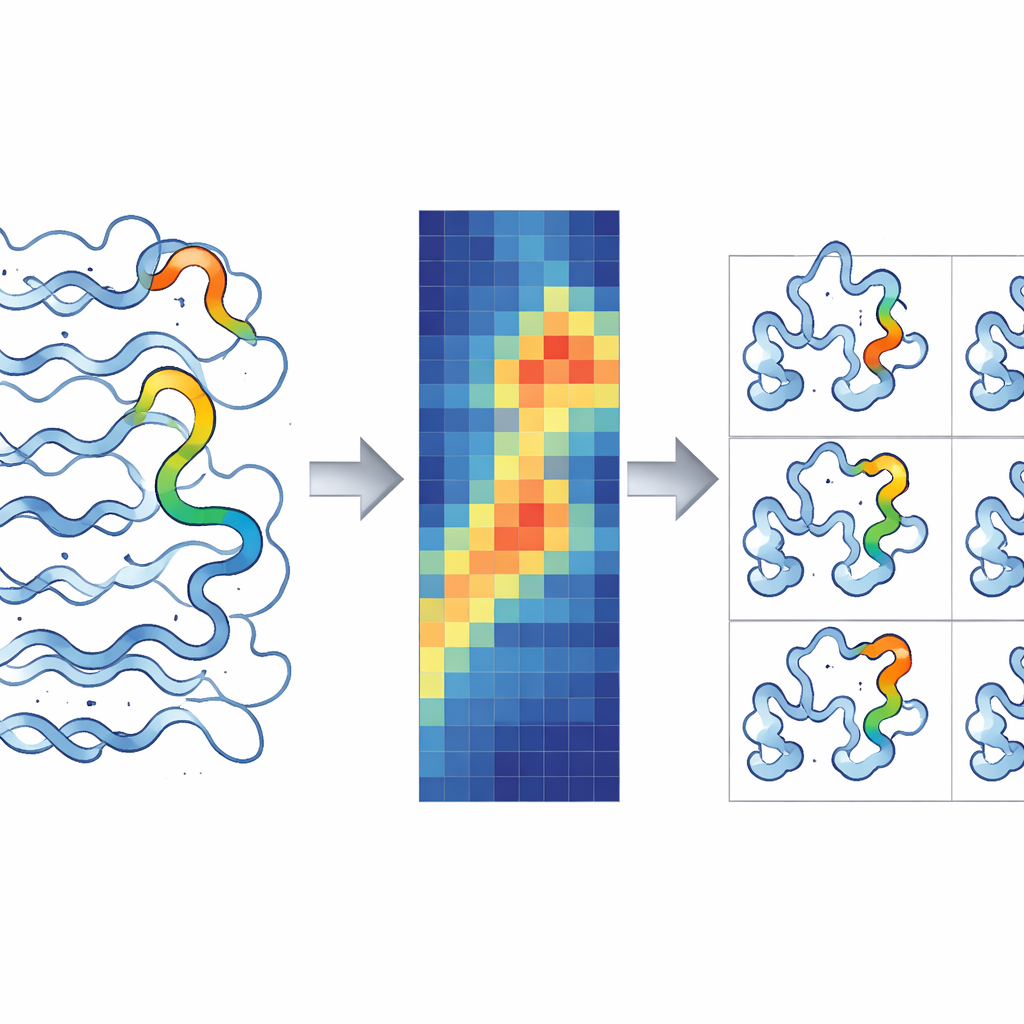
To show what these tools can reveal, the authors applied RMSX and Flipbook to three very different proteins. In a forced-unfolding simulation of ubiquitin—a small, springy protein—they showed how motion concentrates at the ends of the chain while a fixed anchor point stays immobile. Flipbook makes this unfolding appear as a spring being pulled apart, with select residues swinging away at specific times. For HIV-1 protease, a key enzyme in the life cycle of HIV, the focus was on two flexible “flaps” that open and close to admit drug molecules or natural substrates. RMSX heatmaps and Flipbook views clearly singled out the tips of these flaps, revealing calm intervals where they stay shut and dynamic periods where they open transiently, details that can be altered by drug-resistance mutations.
Seeing How Proteins Resist Force
The third test case involved SdrG, a bacterial adhesion protein that clings to human fibrinogen with extraordinary strength. Under strong pulling forces, parts of SdrG tighten and shift in a way that actually stabilizes the bond, a phenomenon called a catch bond. By combining RMSX with another metric that tracks cumulative shifts over time, and visualizing both with Flipbook, the authors could watch specific loops tighten, rearrange, and then gradually relax as pulling continued. This pairing allowed them to separate simple drift of the protein from genuine bursts of local motion, building a more complete picture of how mechanical force reshapes the binding site.
What This Means for Protein Science
In the end, RMSX and Flipbook provide a practical, open-source toolkit for turning raw simulation trajectories into clear, publication-ready stories about protein motion. RMSX merges the strengths of older measures by revealing, in a single view, which residues move and when they do so. Flipbook then projects those numbers onto 3D structures, turning abstract curves and grids into intuitive scenes of flexing loops and rigid cores. Used alongside other measures that track long-term drift or fine local rearrangements, these tools help researchers detect fleeting structural events that may underlie allostery, force sensing, or drug binding. For non-specialists, they also offer a more accessible way to “see” the restless lives of proteins that power biology.
Citation: Beruldsen, F., de Freitas, M.V. & Antunes, D.A. High resolution mapping of protein motions in time and space with RMSX and Flipbook. Sci Rep 16, 10035 (2026). https://doi.org/10.1038/s41598-026-39869-7
Keywords: protein dynamics, molecular simulations, visualizing motion, protein flexibility, biomolecular structure