Clear Sky Science · en
The Role of Feedback Loops in Dynamical Symptom Networks
Why this matters for everyday mental health
Many people think of depression as a list of separate symptoms, like low mood, poor sleep or lack of energy. This study asks a different question: what if the real problem is how these symptoms keep each other going over time? Using computer simulations and clinical data, the authors show that certain “loops” of symptoms can trap people in long-lasting depression, and that breaking the right links in this web may be more effective than treating symptoms one by one.
Seeing depression as a web, not a checklist
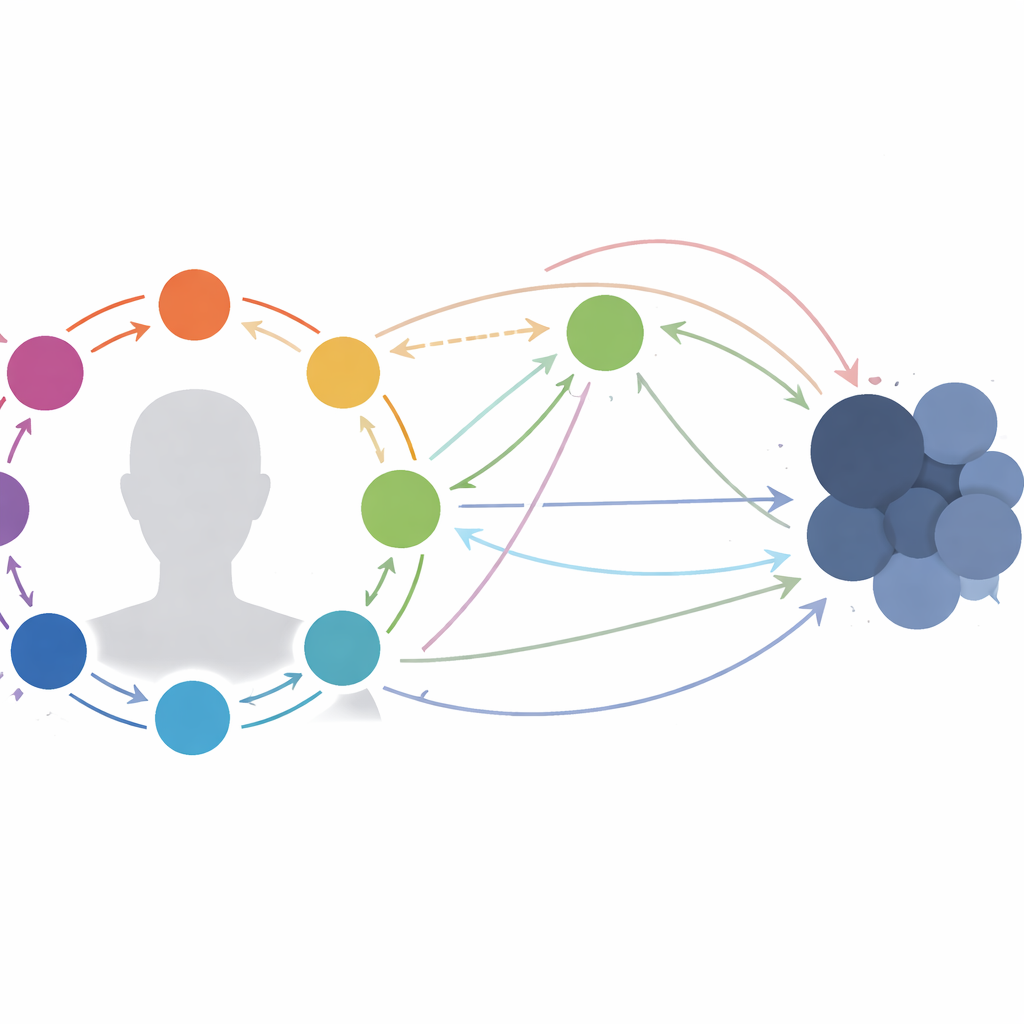
Instead of treating symptoms as isolated, the researchers model them as a network. Each symptom can influence others: trouble sleeping can increase fatigue, fatigue can lower mood, low mood can fuel guilt, and so on. When these influences form closed circles, the system contains feedback loops—paths where activation comes back to where it started. The authors build on a nine-symptom depression questionnaire and generate almost 100,000 possible directed networks that all fit known correlations between symptoms. They then simulate how symptoms rise and fall after a temporary “shock” representing a stressful life event, and watch how long it takes for the system to calm down.
More loops raise symptoms, but only up to a point
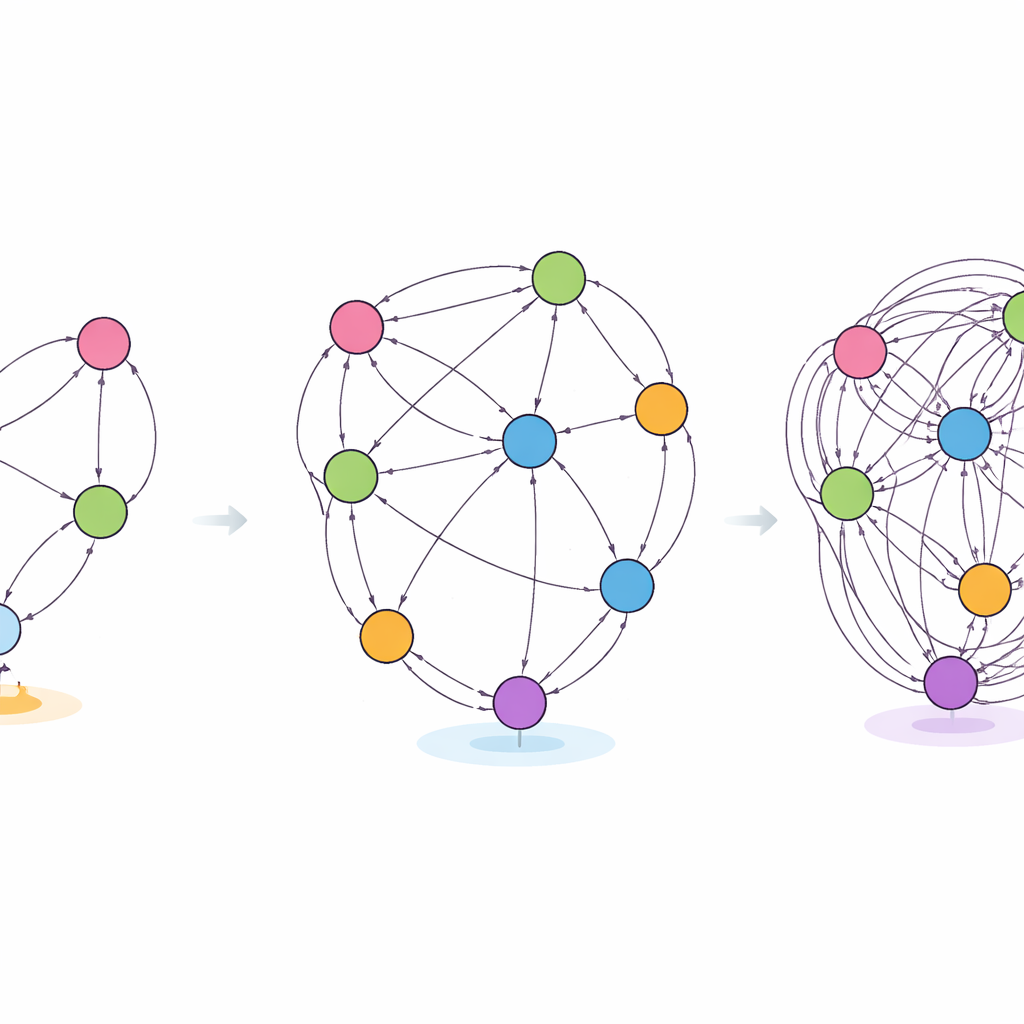
Across this huge family of networks, one pattern is clear: networks with more feedback loops tend to keep symptoms higher for longer after the shock has passed. The system shows hysteresis—once pushed into a high-symptom state, it does not easily return to a healthy state even when the stressor is removed. Yet this effect is not endless. Beyond roughly ten to seventeen loops, adding more loops hardly increases average symptom levels. The reason is structural: as additional loops are added, they increasingly share the same symptom nodes. Instead of many independent reinforcing cycles, the network behaves more like one large, overlapping feedback structure, so each extra loop contributes less new “fuel.”
How balance and overlap shape persistence
The authors then look beyond loop counts to ask how loops are arranged. First, they measure how evenly each symptom sends and receives influence. When connectivity is spread fairly evenly—so no single symptom dominates—networks with many loops are especially good at maintaining high overall symptom levels. Activation can circulate widely, making it harder for the system to recover. In contrast, if connections are highly uneven and concentrated in a few symptoms, high symptom levels are less stable because disrupting those key hubs has a bigger impact. Second, they measure how much loops overlap by sharing nodes. When loops are mostly separate, networks with many loops show high and persistent symptom levels. When loops overlap strongly, symptom levels plateau: the extra loops recycle through the same few symptoms and add little new reinforcement.
Zooming in on critical connections
To understand which pieces of the web matter most, the team compares simulated networks that end up with very high symptom levels to those that recover well. Simply counting how often each symptom participates in loops does not separate the two groups: the same core symptoms—such as sadness, low energy and guilt—are involved in both. The key differences lie in specific connections and how they are woven into larger loop patterns. High-symptom networks show extended chains of feedback that span most symptoms, forming large, interlinked cycles. Lower-symptom networks, even with the same number of loops, tend to have smaller, more local cycles centered on a few nodes. One especially notable pattern is a tight two-way loop between sadness and guilt, which appears far more often in high-symptom networks and is also prominent in real patient data.
Bridging simulations and real-world patients
To test whether these simulated patterns are realistic, the authors analyze time-series data from 254 patients in a psychotherapy trial. Using a causal discovery method, they estimate directed symptom networks for each person and tally which connections show up most often. Several of the most frequent real-world edges match the connections that characterize high-symptom simulations, including the mutual reinforcement between sadness and guilt. This overlap suggests that the simulated networks capture structural features that also arise when people report their symptoms over many weeks, even though the clinical data are limited and simplified.
What this means for treatment
Overall, the study concludes that the stubbornness of depression is shaped not just by whether feedback loops exist, but by how many there are, how they overlap, how evenly influence is spread, and which specific connections close the loops. For a lay reader, the message is that depression can behave like a tangled web of self-reinforcing problems. Trimming a few strands may not be enough if key cycles remain intact. The work suggests that future interventions—whether psychological, social or biological—could be more effective if they focus on disrupting the most influential feedback structures and high-impact symptom links, rather than trying to reduce all connections at once or targeting isolated symptoms in isolation.
Citation: Park, K., Li, X., Waldorp, L. et al. The Role of Feedback Loops in Dynamical Symptom Networks. Sci Rep 16, 11273 (2026). https://doi.org/10.1038/s41598-026-38747-6
Keywords: depression networks, feedback loops, symptom dynamics, computational psychiatry, mental health relapse