Clear Sky Science · en
Towards three-dimensional discrete fracture network modeling using integrated multidimensional outcrop data
Why underground cracks matter
Hidden beneath our feet, networks of tiny cracks in rock can decide whether groundwater flows freely, whether oil and gas can be produced efficiently, or whether carbon dioxide injected underground will stay put. Yet these fracture networks are hard to see in three dimensions, because wells and seismic surveys only give partial snapshots. This study shows how detailed images of a rocky cliff in Brazil, combined with modern computing and statistics, can be turned into realistic 3D models of these underground cracks, improving our ability to predict how fluids move through the subsurface.
A natural window into the subsurface
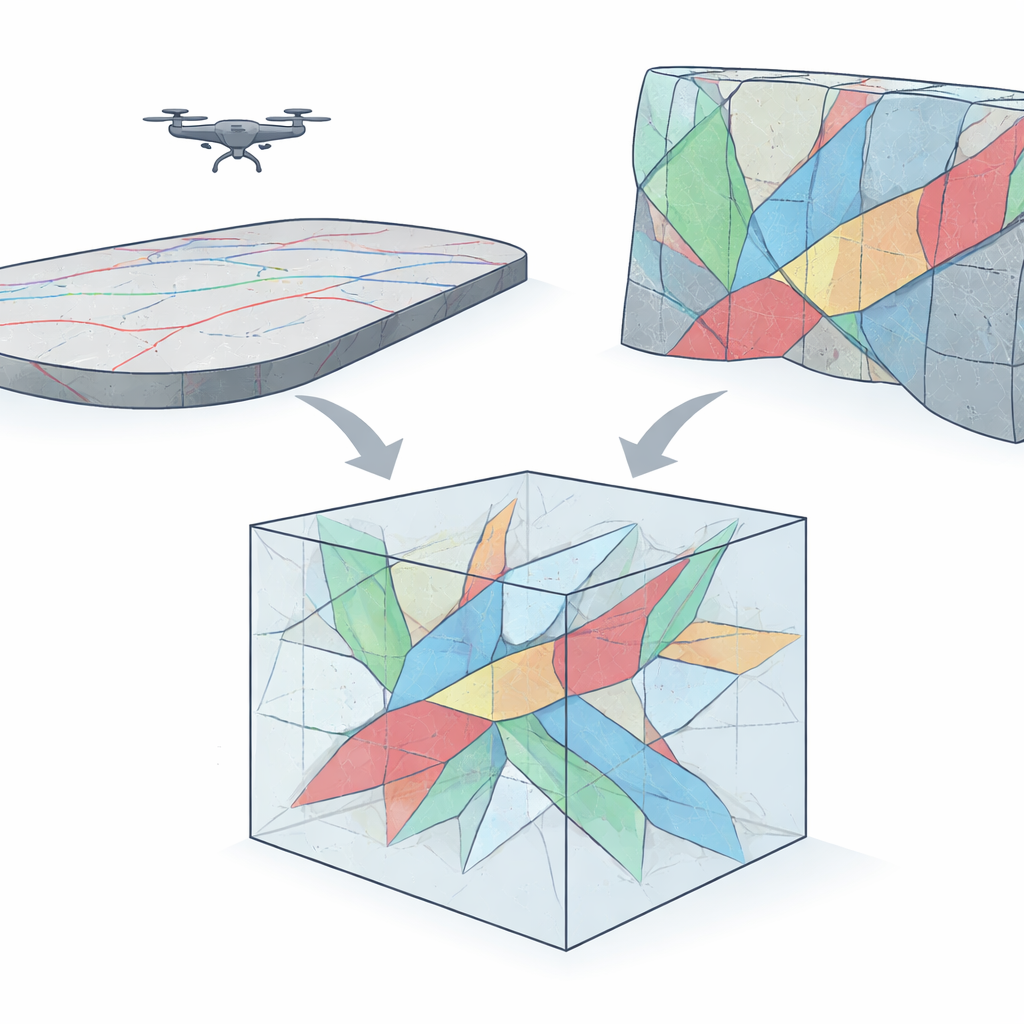
The researchers focused on the Gaivota outcrop in Brazil’s Potiguar Basin, where layers of carbonate rock from the Jandaíra Formation are exposed both as a broad, nearly flat surface and as a steep vertical wall. This natural geometry provides two complementary views of the same rock body: from above, where long fracture traces can be mapped, and from the side, where full fracture planes are visible. The team used drone photography and photogrammetry to build a detailed digital 3D model of the outcrop, then painstakingly mapped more than 1,600 surface fractures and nearly 500 fracture planes. Because similar rocks host important hydrocarbon reservoirs, this site serves as a real-world laboratory for understanding how fracture patterns control fluid storage and flow.
From fracture maps to 3D crack families
Turning these observations into a usable 3D fracture model required separating the fractures into meaningful “families” that share similar orientations. The authors applied a clustering method called K-means, adapted for data that lie on a sphere, to group the 3D fracture planes into four direction sets. They then tested how tight and well balanced these groups were using Fisher statistics, a tool that measures how strongly directions are clustered around a mean. These direction families were used as the backbone of the model: each family represents one dominant way the rock is broken, reflecting the region’s complex tectonic and karst history.
Capturing sizes, patterns, and realistic volumes
Knowing which way fractures point is only half the story; modelers also need realistic fracture lengths and spacing. For the surface fractures, the team examined how lengths are distributed using several candidate mathematical forms, including power laws and exponential curves. They estimated the key parameters with a machine-learning optimization method called stochastic gradient descent. Most fracture families followed a power-law pattern, meaning there are many small fractures and progressively fewer large ones, a hallmark of fracturing that grows in a self-similar, or fractal, way. To avoid building models that are either too small to be representative or unnecessarily large, the authors also calculated a “representative elementary volume” — the minimum block size for which fracture properties like area per volume become stable. This step ensured that their 3D fracture cubes reflect average behavior rather than local quirks.
Building and testing synthetic fracture worlds
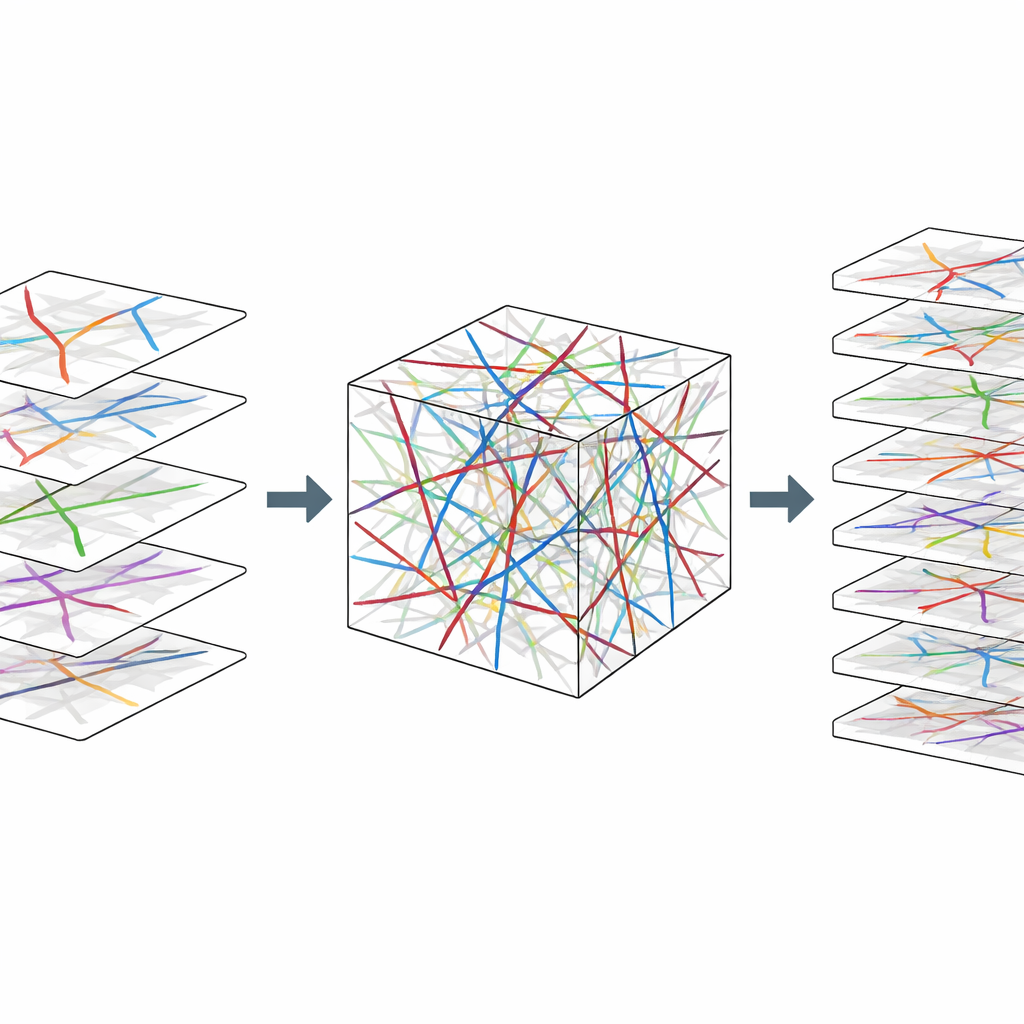
With orientations, length distributions, and a representative volume in hand, the researchers generated two kinds of 3D fracture models. A pseudo-deterministic model directly incorporated the mapped fracture planes, assigning lengths drawn from the fitted distributions. A fully stochastic model created new, random fractures that obeyed the same statistics for each family and were added until a target fracture area per volume was reached. Both models were then sliced in many directions to compute standard fracture measures in 2D (length per area) and 3D (area per volume), as well as how well the fractures connect to one another. The comparison showed that the synthetic models closely reproduced the real outcrop’s fracture intensity and connectivity, especially when examined family by family rather than all at once.
Linking surface clues to hidden structures
One of the most practical findings is the strong link between 2D and 3D fracture measures. The authors found that the fracture length per unit area measured on a plane is tightly correlated with the fracture area per unit volume in the surrounding rock, with correlation values above 0.9. They also observed that as fracture intensity increases, connectivity tends to increase in similar fashion, suggesting that denser fracture networks also provide more continuous pathways for fluid flow. Importantly, these relationships emerged from models grounded in real outcrop data but extended into volumes far beyond what is directly visible.
What this means for water, energy, and storage
For non-specialists, the key message is that careful integration of high-resolution surface images, 3D outcrop geometry, and advanced statistical tools can turn patchy observations of rock fractures into robust three-dimensional models. These models help translate what geologists see on exposed cliffs into predictions about the hidden rocks that hold fresh water, oil and gas, or injected waste fluids. By showing that relatively accessible 2D measurements can reliably predict 3D fracture properties and connectivity, this work offers a practical workflow that can improve the design and safety of subsurface operations, from groundwater management to energy production and carbon storage.
Citation: Racolte, G., Marques, A., Sales, V. et al. Towards three-dimensional discrete fracture network modeling using integrated multidimensional outcrop data. Sci Rep 16, 10087 (2026). https://doi.org/10.1038/s41598-026-37359-4
Keywords: fracture networks, 3D geological modeling, carbonate reservoirs, outcrop photogrammetry, subsurface fluid flow