Clear Sky Science · en
Predicting drainage capillary pressure curves in natural porous media by NMR-T2 relaxometry: implications for CO2 storage
Why this research matters for climate solutions
Storing carbon dioxide deep underground is one of the few tools we have to slow climate change while we transition away from fossil fuels. But before engineers can safely inject CO2 into rocks a kilometer or more below our feet, they must be sure those rocks – and, crucially, the sealing layers above them – can keep the gas locked away for centuries. This study presents a new way to predict how well different rocks can trap CO2 using a fast, non-destructive magnetic scan instead of slow, toxic mercury tests.
How rocks hold and trap underground fluids
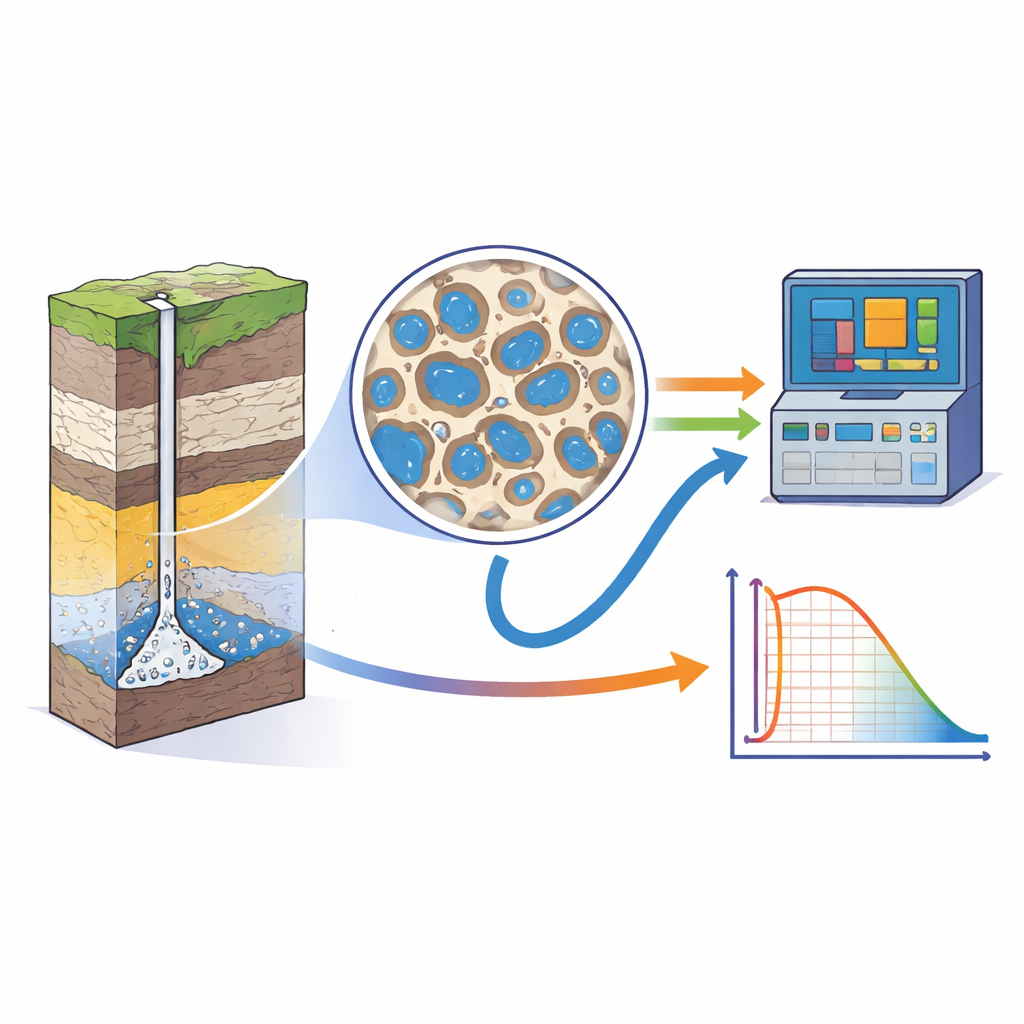
Deep underground, rocks are not solid blocks; they are shot through with tiny pores and throats that can hold water, oil, gas, or injected CO2. Whether CO2 stays put or escapes upward depends on how easily it can squeeze through those narrow passages. This behavior is described by “capillary pressure” curves, which relate how much of a rock is filled with a non-wetting fluid (like CO2 or mercury) at a given pressure. Traditionally, laboratories measure these curves by forcing mercury into small rock samples at very high pressures, then converting the results to conditions expected for CO2 and salty water. These mercury tests are destructive, costly, hazardous, and are usually run on only a few samples along a well, leaving large gaps in our picture of the subsurface.
A safer way to listen to the rock’s pores
Low-field nuclear magnetic resonance (NMR) offers a different approach. Instead of injecting mercury, scientists saturate a rock with brine and use a magnetic pulse sequence to measure how quickly hydrogen nuclei in the fluid relax, described by a parameter called T2. The distribution of T2 values is sensitive to the size and surface properties of the pores: large pores give long T2 times, tiny pores give short ones. In principle, this relaxation “fingerprint” should be related to the same pore-throat geometry that controls capillary pressure. Previous methods tried to convert T2 spectra directly into capillary curves using simple formulas that assume uniform rock properties. Those assumptions often fail in real formations, especially in complex carbonates and tight mudstones, and they usually require rock-type-specific calibration.
Teaching a model to recognize rock behavior
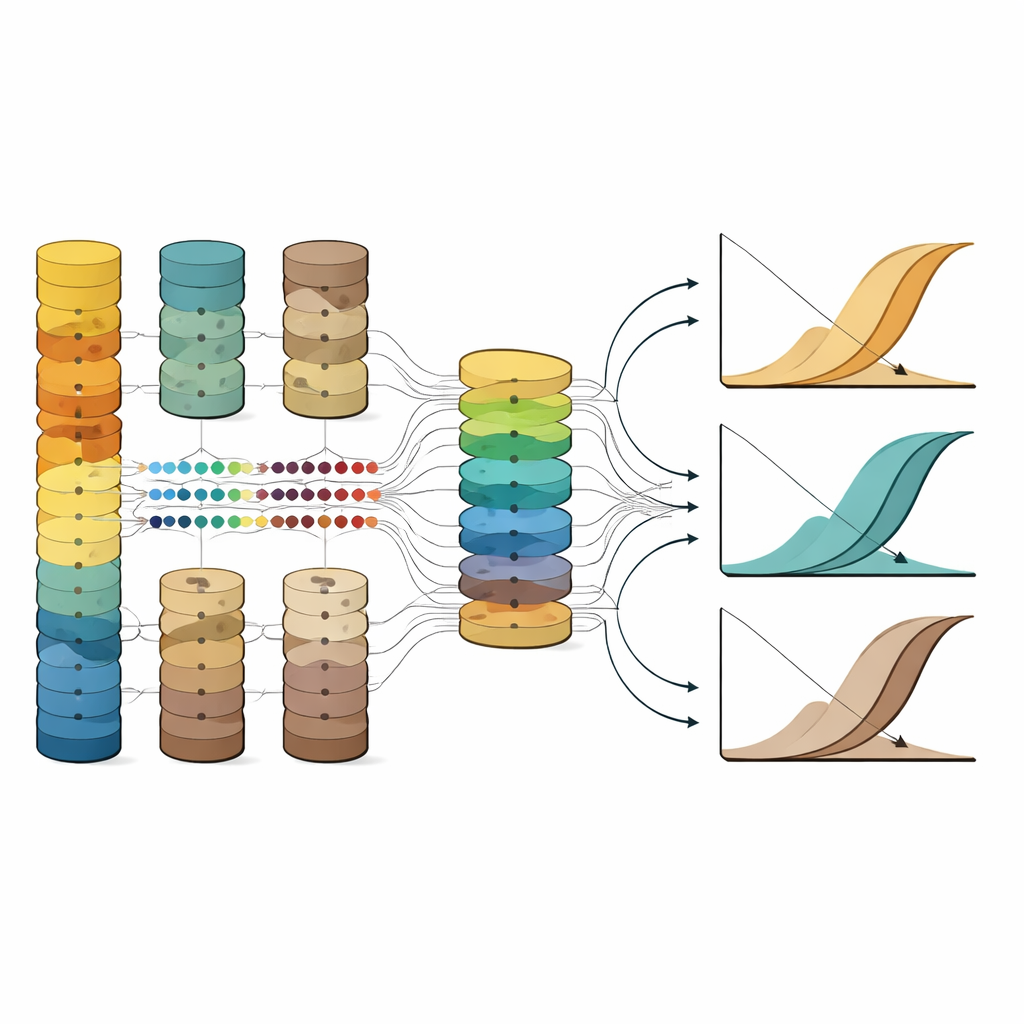
The authors developed a data-driven model that learns the relationship between NMR measurements and mercury-based capillary curves across many rock types. They compiled a database of 36 core samples, including sandstones, limestones, and tight mudstones with permeabilities spanning more than seven orders of magnitude. For each sample, they combined information from routine core analysis (porosity and permeability), detailed NMR T2 distributions, and mercury injection data. They then engineered several physically inspired features: a J parameter that ties pressure to rock quality and wettability, a bimodality index that quantifies whether the pore system has one or two dominant size ranges, and a bin-weighted logarithmic mean T2 that captures the skewness of the pore-size distribution. Using these features, they trained a gradient-boosted decision-tree model (CatBoost) to predict mercury saturation at any given pressure from the NMR and rock inputs.
How well the new method performs
To ensure that the model truly generalized beyond the training data, the team used a strict leave-one-sample-out validation and then tested the final model on six additional “blind” cores that were never seen during training. Across a wide pressure range from roughly 0.5 to 50,000 psi, the model reproduced the measured mercury capillary curves with an average coefficient of determination (R²) of 0.94 and a mean absolute error in saturation of about 3.6 percent on the blind set. The method performed consistently for sandstones, carbonates, and tight mudstones. Sensitivity analysis showed that the pressure-scaled J parameter dominated predictions, while the NMR-derived features refined the curve shape, capturing differences in pore system structure. When the predicted mercury curves were converted to brine–CO2 conditions using standard scaling relationships, they closely matched the converted laboratory curves used in CO2 storage studies.
What this means for future CO2 storage projects
The study demonstrates that carefully designed machine-learning models can turn fast, non-destructive NMR measurements into reliable capillary pressure curves, greatly reducing the need for hazardous mercury injection tests. Because NMR tools are already deployed both in the lab and on wireline logging instruments in wells, this approach could enable near-continuous profiling of sealing capacity and trapping behavior along an entire borehole. While the authors note limitations, such as the assumption of water-wet conditions and the current size of the training dataset, their results suggest a practical path toward safer, cheaper, and more extensive assessment of underground CO2 storage sites – helping engineers better judge how securely injected carbon can be kept out of the atmosphere.
Citation: Markovic, S., Kurochkin, A., Efara, M. et al. Predicting drainage capillary pressure curves in natural porous media by NMR-T2 relaxometry: implications for CO2 storage. Sci Rep 16, 11540 (2026). https://doi.org/10.1038/s41598-026-36861-z
Keywords: CO2 geological storage, capillary pressure, nuclear magnetic resonance, machine learning in petrophysics, rock pore structure