Clear Sky Science · en
Analysis and nomograph development for a leaky pipeline carrying plug flow based on numerical modeling and experimental validation
Why leaky underwater pipes matter
From offshore oil and gas fields to future carbon capture projects, many of the world’s most important fluids travel through long underwater pipelines. If these lines develop leaks, escaping gas can threaten safety, damage the environment, and disrupt energy supplies. Detecting such leaks is surprisingly difficult when gas and liquid flow together in an unsteady, churning pattern called plug flow. This study combines advanced computer simulations with carefully controlled laboratory experiments to understand how leaks behave in such conditions and to provide engineers with a practical tool for estimating how fast gas will escape underwater.
Watching plugs of gas and liquid in motion
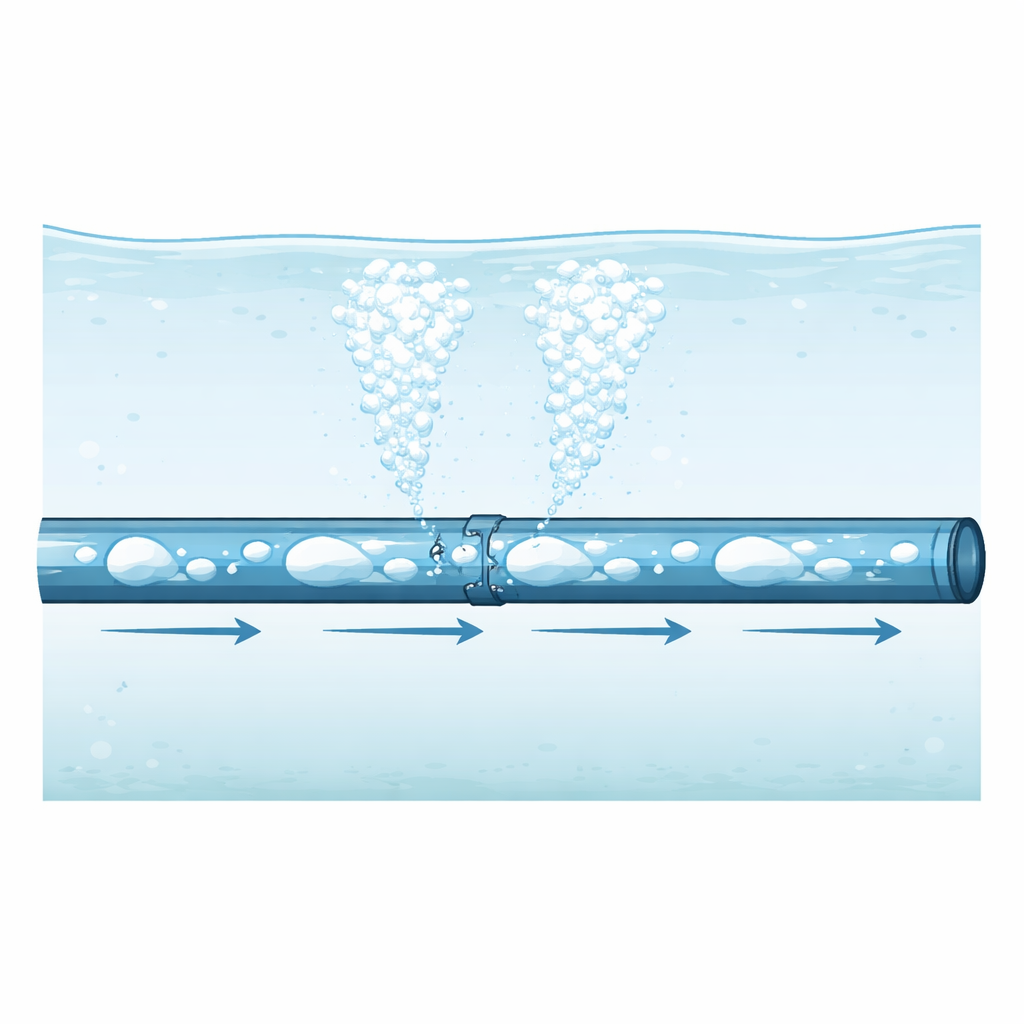
In plug flow, elongated pockets of gas move like trains through a pipe filled mostly with liquid. This pattern is common in oil and gas production lines and is far more chaotic than a steady single-phase flow. The researchers built a three-dimensional computer model of a horizontal pipe that carried air and water in plug flow while submerged in a surrounding water tank, mimicking an underwater pipeline. They represented the moving interface between gas and liquid using a technique known as the Volume of Fluid method and chose operating conditions that match real industrial ranges. Several leak configurations were tested, from a single small opening to larger and multiple holes, and for different gas and liquid velocities.
Putting the model to the test in the lab
To ensure the virtual pipeline reflected reality, the team compared their simulations with experiments performed on a full-scale multiphase flow loop. A six-meter-long pipe with controlled artificial leaks was connected to a transparent water tank so that escaping gas could be seen as it rose. Sensitive pressure sensors were installed upstream and downstream of the leak locations, while cameras recorded the motion of the elongated gas bubbles. The agreement between simulated and measured pressure drops, gas volume fractions, and bubble shapes was generally good, with average differences around ten percent. This gave confidence that the model could be used to explore many leak scenarios that would be costly or impractical to reproduce experimentally.
How leaks change pressure and gas content
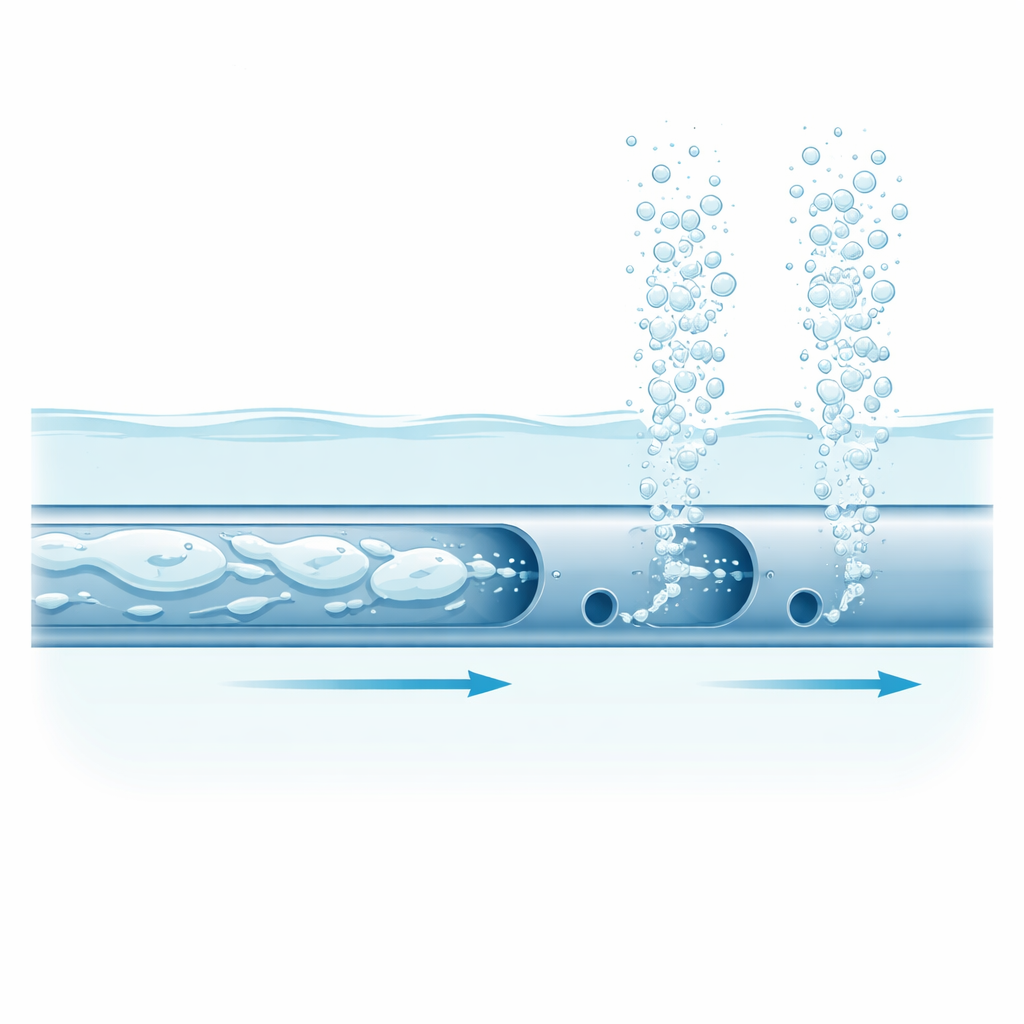
The study reveals that leaks subtly but systematically alter the pressure signals inside the pipe and the distribution of gas along it. At low gas speeds, much of the gas escapes through the leak, leaving the downstream part of the pipe filled mostly with liquid. As gas speed increases, more gas is carried past the leak so that a smaller fraction is lost. Multiple small leaks can actually vent more gas than one larger leak of the same total area. Simple inspection of pressure traces is not enough to spot leaks, because the natural ups and downs created by plug flow can mask leak effects. To tackle this, the team analyzed the signals statistically, looking at measures such as variability and the overall pattern of pressure values, and also examined how the energy of the fluctuations is distributed across different frequencies using wavelet transforms. These methods showed that leaks tend to dampen certain oscillations and reshape the probability distribution of pressures, especially when the gas speed is low.
A practical chart for estimating escaping gas
Beyond understanding the physics, the authors wanted a simple way for engineers to estimate how fast gas will rise from a leak in an underwater plug-flow pipeline. They used a classic non-dimensional analysis, which groups physical quantities into scale-free combinations, to link the leak’s depth, opening size, pipe diameter, and flow rates to two key outcomes: how much gas is present in the pipe and the upward speed of the gas plume in the surrounding water. From hundreds of simulation results, they built a nomograph—a graphical calculator—that allows a user to read off the expected gas release velocity once a few basic parameters are known. When tested against laboratory measurements, the chart predicted gas content in the pipe and gas rise speed with reasonable accuracy.
What this means for real pipelines
For non-specialists, the main message of this work is that leaky multiphase pipelines do leave telltale fingerprints in their pressure signals, but these fingerprints only become clear after careful time-series analysis. The study shows that plug flow, once thought too chaotic for reliable leak detection, can in fact be characterized and used to infer how much gas is escaping into surrounding water. The newly developed nomograph offers a practical bridge between sophisticated simulations and everyday engineering, helping operators estimate leak severity and improve safety assessments for subsea pipelines that transport mixtures of gas and liquid.
Citation: Ferroudji, H., Barooah, A., Hassan, I. et al. Analysis and nomograph development for a leaky pipeline carrying plug flow based on numerical modeling and experimental validation. Sci Rep 16, 12128 (2026). https://doi.org/10.1038/s41598-026-36759-w
Keywords: pipeline leak detection, multiphase plug flow, underwater pipelines, gas release modeling, time-series pressure analysis