Clear Sky Science · en
Wave spectrum Reconstruction Parameters for nested wave modeling in the China-adjacent seas from 2000 to 2024
Why Saving Waves Matters
Coastal communities, offshore engineers, and the growing wave-energy industry all depend on knowing how the sea surface behaves over long periods. But modern computer models don’t just track wave height; they describe the full "wave spectrum"—how energy is spread across different sizes and directions of waves. That detailed picture is powerful, yet so data-heavy that long-term simulations can become impractical to store and share. This study tackles that problem for one of the world’s busiest ocean regions: the seas surrounding China.
A New Way to Pack Ocean Wave Data
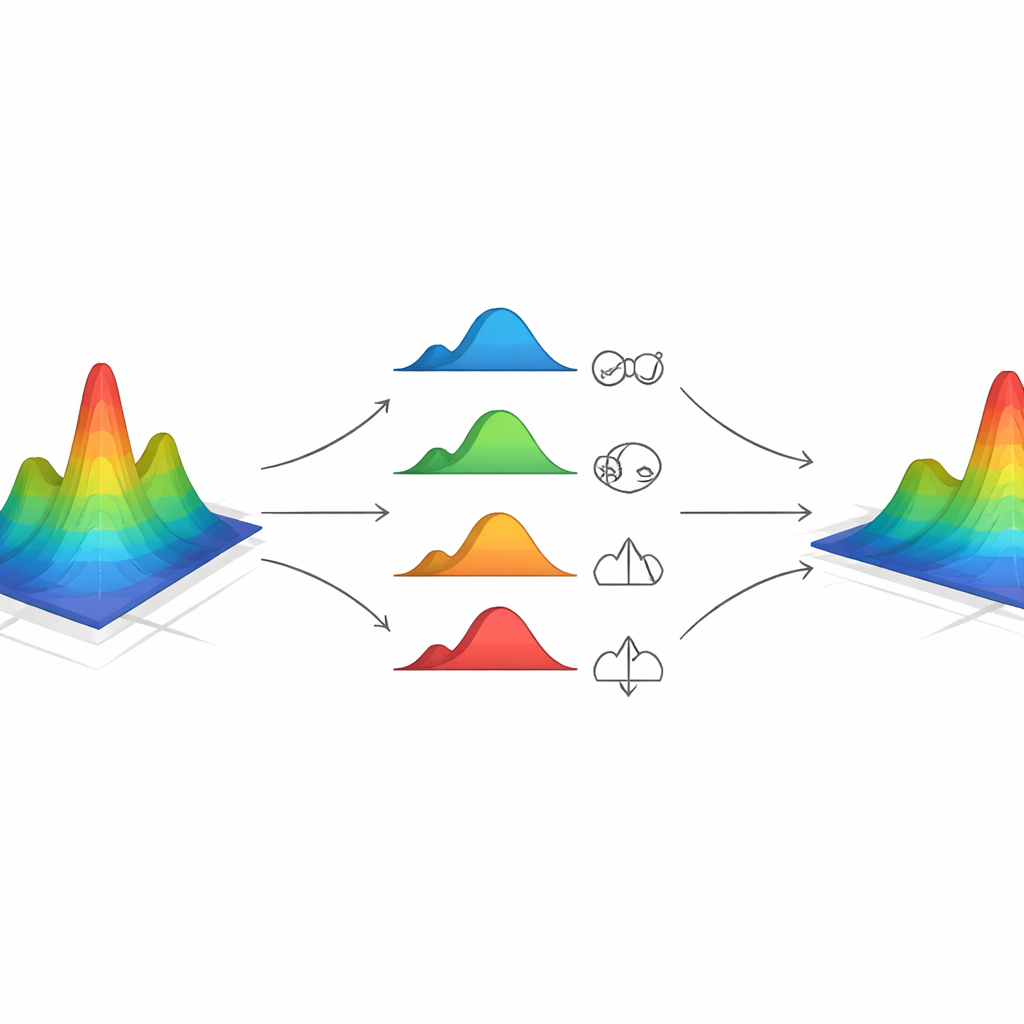
Instead of saving every detail of the modeled wave spectrum at every location and hour, the authors build on a recently proposed idea: describe each spectrum using a compact set of "reconstruction parameters." In simple terms, the model first breaks a complex sea state into a few simpler wave systems, such as locally generated wind waves and distant swells. For each of these systems, a small collection of numbers captures how energetic it is, what its characteristic period is, and how its energy spreads over frequencies and directions. These numbers are chosen so that, taken together, they can be used later to rebuild the original two-dimensional spectrum with high fidelity.
Covering 25 Years of Waves Around China
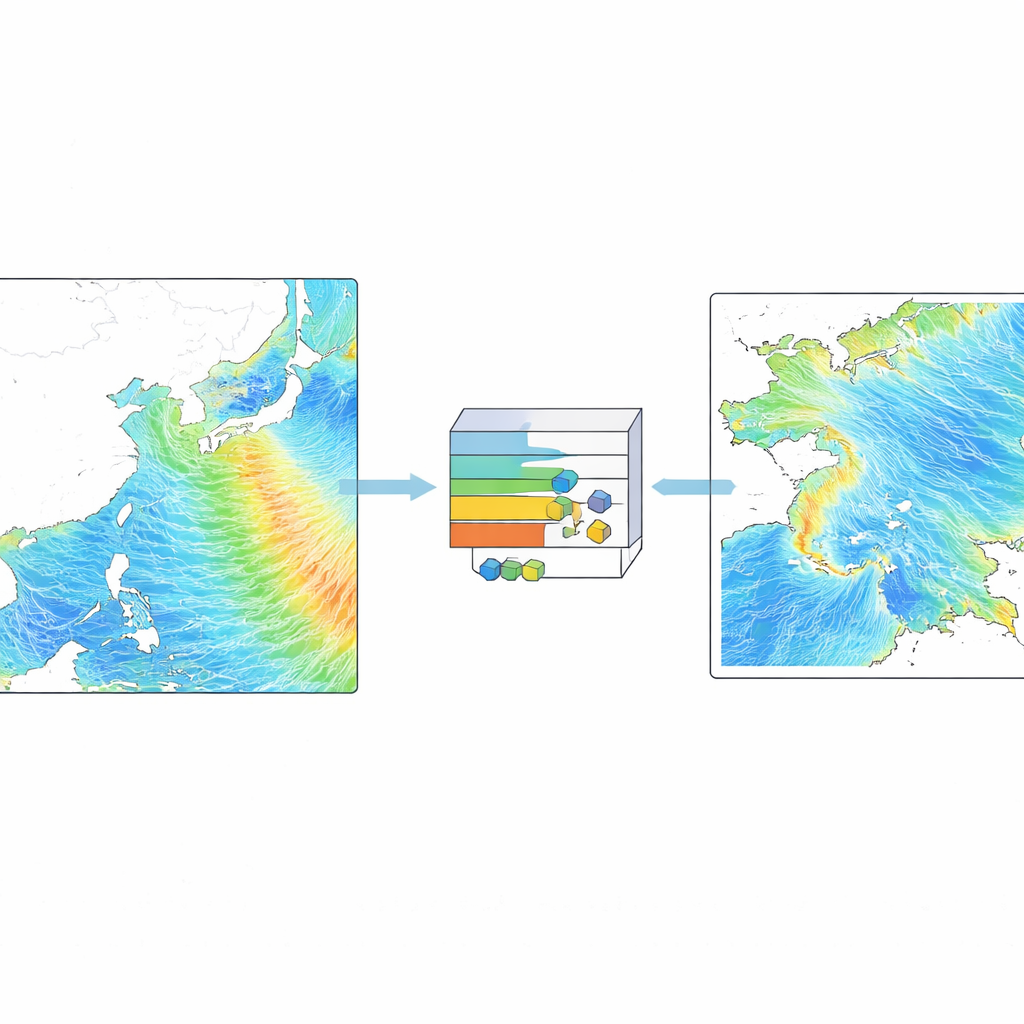
Using a well-established wave model (MASNUM-WAM), the team simulated surface waves over a large domain covering the China-adjacent seas, from the South China Sea to the waters east of Japan, at a spatial resolution of 1⁄12 of a degree and hourly time steps. For each of more than 165,000 grid points and each hour between 2000 and 2024, the model output was converted into up to six wave systems, each described by 13 reconstruction parameters. The resulting dataset, stored in efficient integer formats and organized in daily NetCDF files, makes it possible to recreate detailed wave spectra anywhere in the region and at any hour over this 25-year period, while using only a fraction of the storage that raw spectra would require.
Making Big Data Small Without Losing the Details
To keep the compressed data physically meaningful and accurate, the authors introduce several practical refinements. They define how to handle cases where a wave system has too few spectral points to fit a smooth curve, storing the original values directly and flagging them with special indicators. They also clip unrealistic values, apply logarithmic transformations, and convert floating-point parameters into 1- or 2-byte integers, which greatly cuts the file size while keeping numerical errors very small. Benchmarks show that, compared with saving full spectra, the reconstruction-parameter approach reduces file sizes by an order of magnitude or more while preserving enough information to reproduce wave statistics used in science and engineering.
Testing Against Buoys, Satellites, and the Original Model
Because this is primarily a data resource, its value depends on how well it reproduces real and modeled seas. The authors compare key wave measures—such as significant wave height, several characteristic periods, wavelength, wave power, and mean direction—computed from the original model spectra and from the reconstructed spectra at three representative offshore locations. The agreement is striking: correlations are typically above 0.95, and biases are tiny. They then confront the reconstructed wave heights with more than 3.8 million satellite measurements from 12 different missions and with in-water buoys at two coastal sites. Across satellites and regions, average errors are on the order of a few tens of centimeters, with strong correlations. Finally, nested high-resolution wave simulations driven by reconstructed spectra at their boundaries produce results that closely match both the original large-scale model and the buoy records, showing that the compressed data work in real modeling workflows.
What This Means for Coasts and Clean Energy
In plain terms, this study shows that you can "zip" highly detailed wave information into a compact format and still "unzip" it later with almost no loss where it matters. For the seas around China, that means 25 years of hour-by-hour, basin-wide wave spectra can be stored, shared, and used as boundary conditions for finer-scale coastal models or for assessing wave energy resources, without overwhelming storage systems. The reconstruction-parameter dataset offers a practical backbone for future wave hindcasts, forecasts, and climate studies in this region, enabling better planning for coastal safety, navigation, and renewable energy development.
Citation: Jiang, X., Yang, Y., Yin, X. et al. Wave spectrum Reconstruction Parameters for nested wave modeling in the China-adjacent seas from 2000 to 2024. Sci Data 13, 685 (2026). https://doi.org/10.1038/s41597-026-07017-5
Keywords: ocean wave modeling, China seas, wave spectra, nested models, marine renewable energy