Clear Sky Science · en
Large-scale modeling for housing condition prediction using machine learning algorithms
Why the State of Our Homes Matters
Whether a home is safe, dry, and comfortable can shape everything from a child’s health to a family’s financial stability. Yet while we track home prices down to individual streets, we rarely have an equally detailed picture of housing quality itself. This study tackles that blind spot by using modern computer techniques to estimate the condition of nearly every housing unit in the United States, creating maps that show where homes are thriving and where they may be putting residents at risk.
From House Prices to Housing Quality
Researchers have long modeled how much homes are worth, but much less is known about how livable those homes are. Existing national surveys offer only coarse snapshots, often at the level of entire states or metro areas, and many government data sets focus on affordability or crowding rather than the physical condition of buildings. Because local agencies collect and rate housing in different ways, there has been no unified, detailed view of housing conditions across the country. This gap makes it hard for planners, health officials, and communities to see where poor-quality housing may be concentrating risks such as mold, leaks, extreme indoor temperatures, or unsafe structures.
Bringing Big Data into the Neighborhood
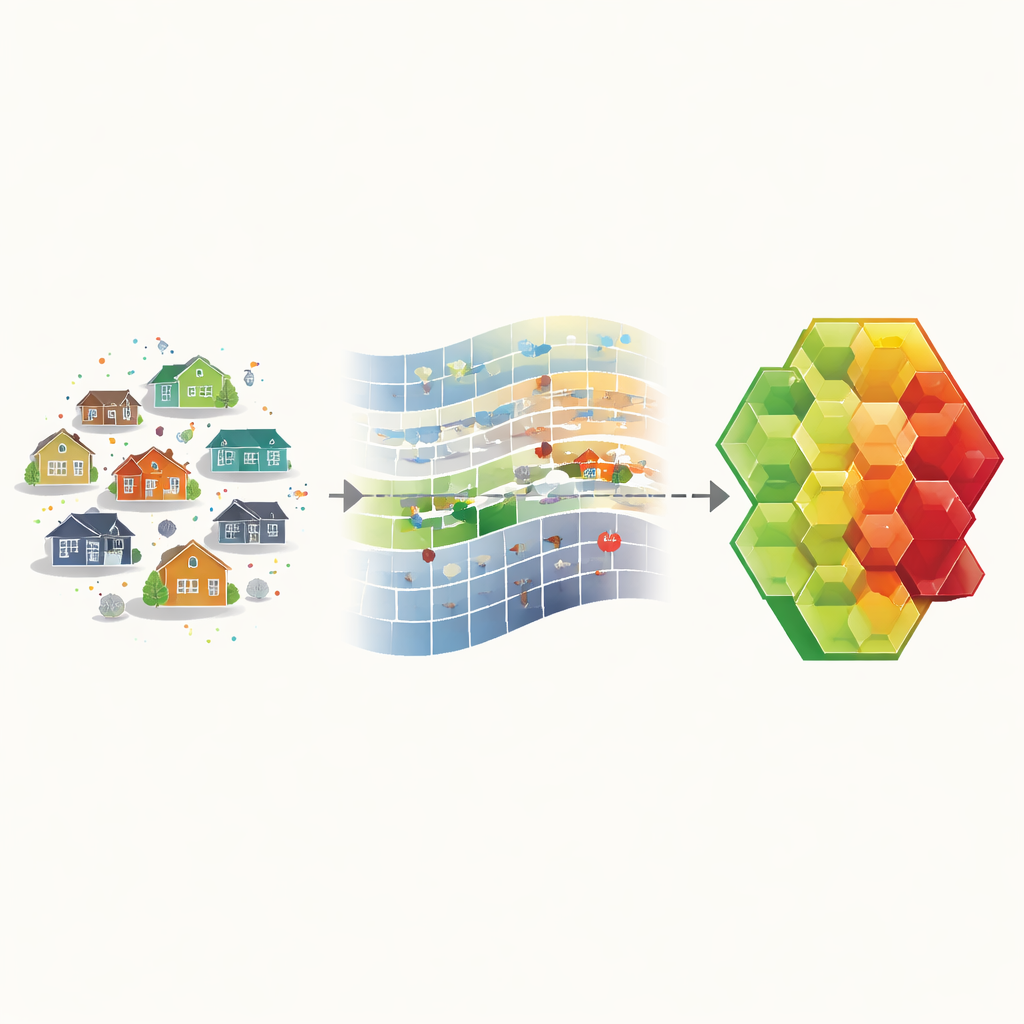
To fill this gap, the authors combined two major data sources. The first is a nationwide property database containing over 111 million housing units, including details like number of bedrooms and bathrooms, year built and renovated, roof and exterior materials, heating system, parking, taxes, and—when available—a six-level rating of building condition from “unsound” to “excellent.” The second source is U.S. Census and related neighborhood data, which describe local income levels, home values, the share of homeowners and mobile homes, population density, poverty, and whether an area is more urban or rural. By spatially matching each property to its surrounding census tract or block group, the team created a unified record that links building traits with the social and economic context around each home.
Teaching Machines to Recognize Housing Health
About half of the properties in the database lacked an official condition rating. The researchers trained three advanced machine-learning models—CatBoost, LightGBM, and XGBoost—on the homes that did have ratings, asking the algorithms to learn how combinations of property and neighborhood features relate to housing condition. They carefully cleaned the data, handled outliers and missing values, and used a high-performance computing cluster—complete with powerful graphics processors—to search efficiently for the best model settings. To avoid models that simply “memorized” the training data, they used balanced accuracy and cross-validation, and then further fine-tuned the winning model so that its estimated probabilities matched real-world outcomes as closely as possible.
Turning Predictions into Useful Maps
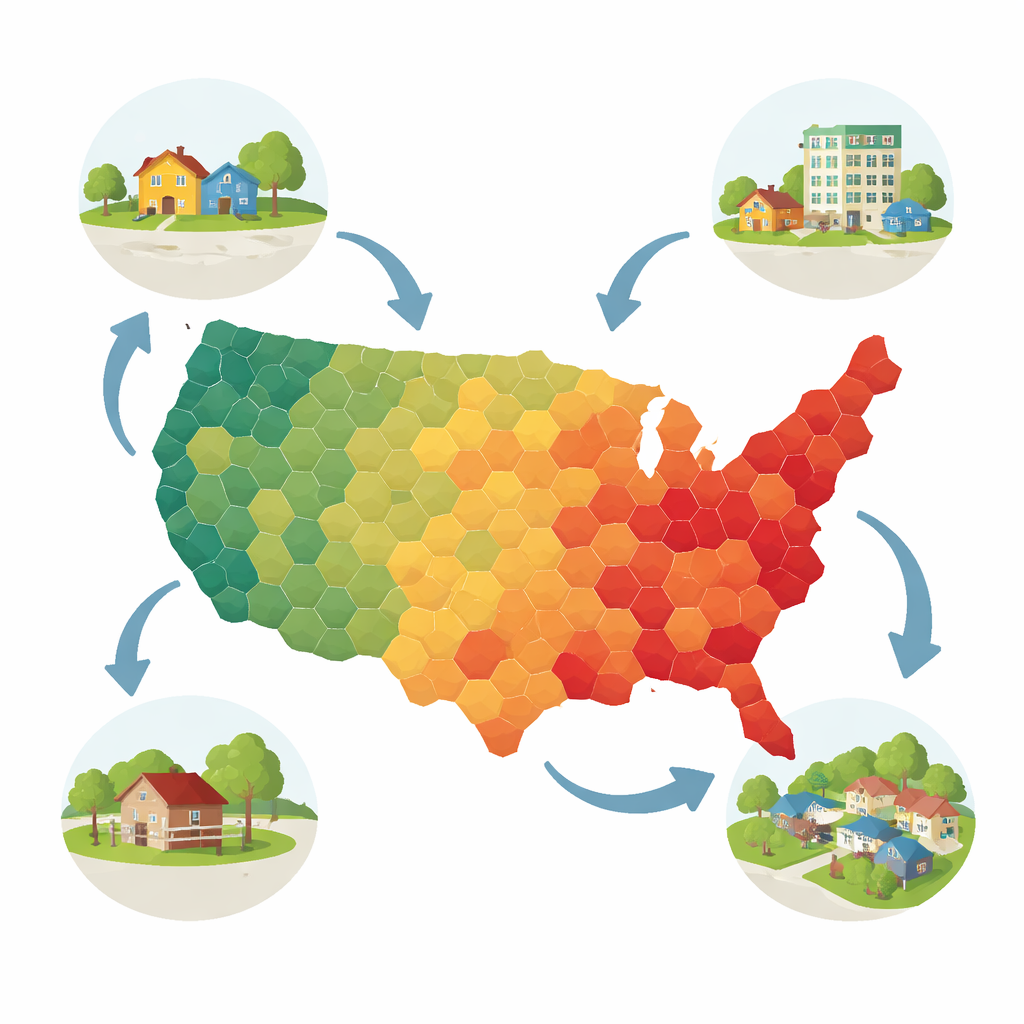
Once the best-performing model (CatBoost) was chosen, it was used to predict condition ratings for the millions of homes with missing information. Each home’s category was translated into a numeric score from one (worst) to six (best). To protect privacy and make patterns easier to see, the researchers then averaged these scores across three types of areas: census tracts, ZIP code tabulation areas, and a regular grid of hexagons about 36 square kilometers in size that blankets the entire country. The result is a set of national maps that reveal broad landscapes of housing quality while still being detailed enough to guide local analysis. The team also checked how well the model performed using multiple statistical tests, finding moderate but meaningful agreement given the size and complexity of the task.
What Drives Better or Worse Homes
By examining which inputs mattered most to the model, the study offers clues about what drives housing condition. Property-level features dominated: estimated tax amount, exterior covering, roof type, heating system, and the age and renovation history of a home were especially influential. Neighborhood factors like poverty rates, population density, and the share of mobile homes played a smaller but still important role. These findings fit with broader research showing that lower-income households, renters, and communities of color are more likely to live in substandard housing, shaped in part by unequal lending practices and uneven enforcement of housing protections.
A New Tool for Safer, Fairer Housing
In simple terms, this work uses patterns in existing records to fill in the missing pieces of a national jigsaw puzzle of housing quality. The resulting publicly available maps and data sets give planners, health agencies, and community groups a powerful new way to see where homes may be putting residents at risk and where investments could yield the greatest benefits. While no model is perfect, especially when working with uneven underlying data, this large-scale approach marks a major step toward understanding—and ultimately improving—the everyday environments people call home.
Citation: Kim, K., Holmes, T., Powell, E. et al. Large-scale modeling for housing condition prediction using machine learning algorithms. Sci Data 13, 647 (2026). https://doi.org/10.1038/s41597-026-07012-w
Keywords: housing quality, machine learning, spatial data, public health, urban planning