Clear Sky Science · en
Tidal Wetland Soil Carbon Accumulation Rates for Coastal California
Why coastal mud matters for climate
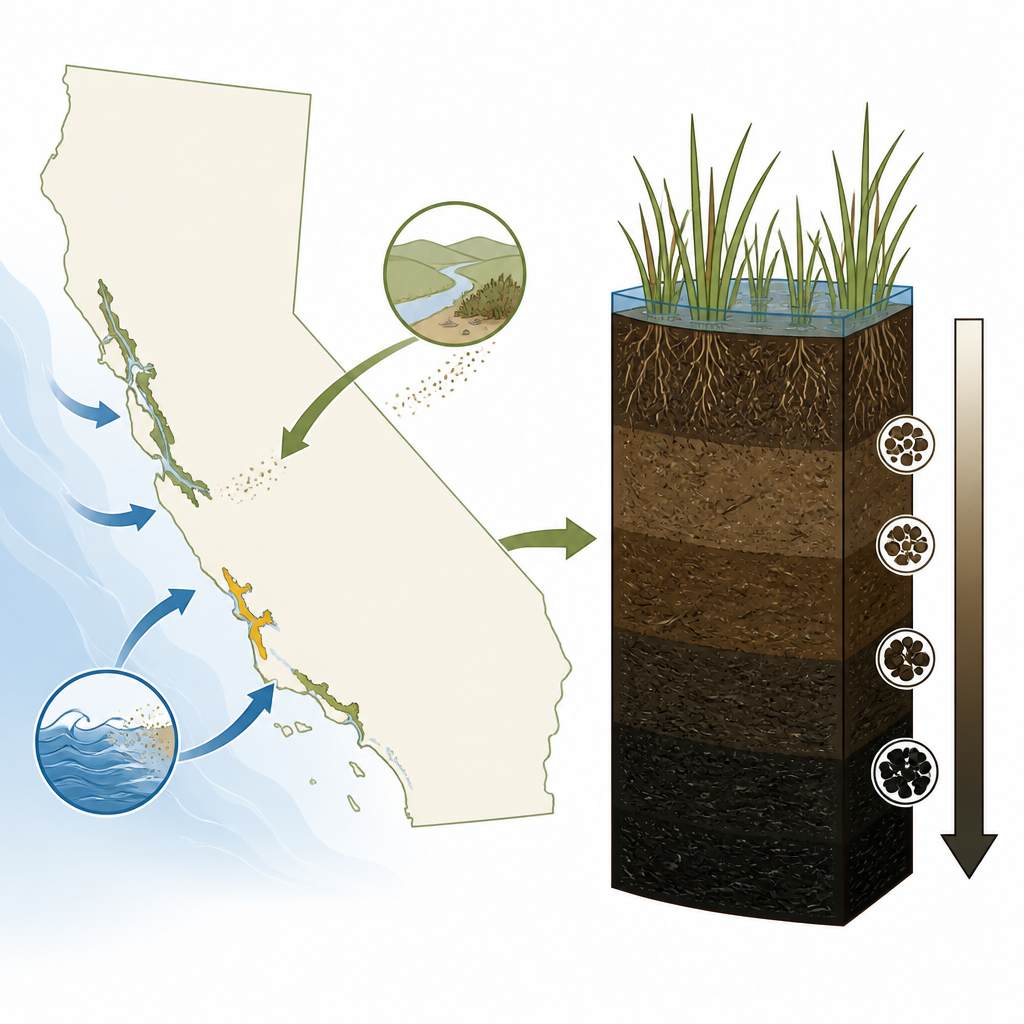
Along California’s ragged shoreline, quiet tidal wetlands are doing big hidden work for the climate. Their muddy soils slowly build up as tides bring in sediment and plants die back, locking away carbon that would otherwise remain in the air. Yet for most of California’s outer coast, scientists and planners have lacked solid numbers on how much carbon these wetlands store and how fast they keep adding more. This study fills that gap with detailed measurements from sites stretching from the Oregon line to the Mexican border, giving decision makers a clearer picture of how these landscapes can help meet climate and coastal protection goals.
Taking a closer look at coastal marshes
The research team collected 83 long, narrow cores of soil from 15 tidal wetland sites, most of them along California’s open coast rather than the better studied San Francisco Bay and Sacramento Delta. Each core is like a vertical timeline of marsh history, built grain by grain as tides and roots add new material. In the lab, the scientists sliced these cores into thin layers down to one meter deep and measured how dense each slice was and how much organic matter it contained. They focused on the top meter because that depth is widely used in global maps and climate guidelines when estimating how much carbon might be lost if wetlands are damaged or drowned.
How the team weighed hidden carbon
To turn mud and plant fragments into carbon numbers, the researchers used a standard heating method that burns off organic matter and then converted those results into estimates of organic carbon. Combining carbon content with soil density for each layer allowed them to estimate how much carbon was stored per square meter of marsh to a depth of one meter. Across 53 deep enough cores from 12 sites, the average stock was about 27.8 kilograms of carbon per square meter, with individual sites ranging from roughly 15 to 45. Organic matter averaged 11 percent of the soil by dry weight and typically declined with depth, suggesting changes in burial or slow breakdown of material over time.
Reading time in layers of mud
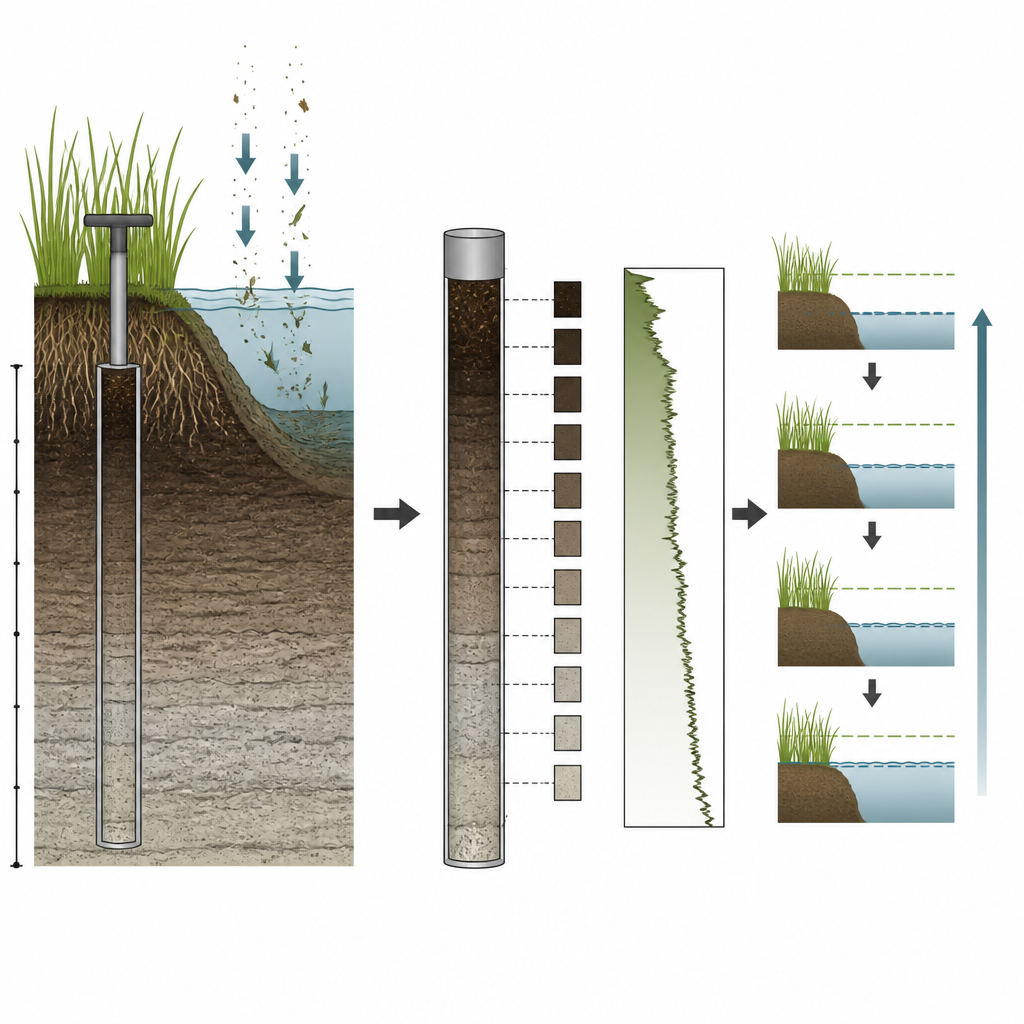
Knowing how much carbon is stored is only half the story; the other half is how fast it accumulates. To estimate time, the team used tiny traces of radioactive elements left by past nuclear tests and natural fallout. Signals from cesium and lead isotopes allowed them to build age–depth models that describe when each soil layer was laid down over roughly the past century. They then combined these models with their carbon density profiles to calculate long term apparent rates of carbon build up. These rates ranged from about 39 to 130 grams of carbon per square meter per year, with a typical value just over 100, close to the default figure used internationally for tidal marshes.
What this means for rising seas
The study also examined how quickly marsh surfaces are rising compared with local sea level. On average, estimated soil buildup was around 3.4 millimeters per year. In central and southern California, this kept pace with or exceeded recent sea level rise, hinting that many marshes there can still maintain their elevation as oceans climb. In Humboldt Bay to the north, a few sites showed slower buildup than local sea level, signaling a greater risk of wetlands converting to open water. The authors caution that their carbon rates likely overestimate the true net carbon benefit because they do not fully account for very slow decay of buried material, but the data still provide a useful first order guide.
A new baseline for coastal planning
For the first time, managers and modelers now have a transparent, site by site dataset on carbon stocks and carbon buildup rates for much of California’s tidal coastline, along with open computer code to repeat or adapt the calculations. The results show that these wetlands store and add carbon at rates similar to global averages, confirming their value in climate planning without overselling them. These numbers can feed into restoration designs, carbon accounting tools, and forecasts of how marshes will respond to rising seas. In simple terms, the work turns coastal mud into clear climate math, helping communities understand what is at stake as they protect or restore tidal wetlands.
Citation: Holmquist, J.R., Brown, L.N., Fard, E. et al. Tidal Wetland Soil Carbon Accumulation Rates for Coastal California. Sci Data 13, 733 (2026). https://doi.org/10.1038/s41597-026-06935-8
Keywords: tidal wetlands, soil carbon, California coast, sea level rise, blue carbon