Clear Sky Science · en
City boundaries for global urban water scarcity assessment
Why City Water Lines Matter to Everyone
As cities swell and headlines warn of “Day Zero” moments when taps could run dry, a basic question remains surprisingly hard to answer: where, exactly, does a city begin and end when it comes to water? This paper presents HydroUrbanMap (HUM), a new global map that traces city boundaries in a way that follows people and pipes, not just bright lights or tall buildings. By redefining city edges around who is actually served by urban water systems, HUM offers a clearer picture of how secure – or vulnerable – city water supplies really are.
From Population Growth to Thirsty Cities
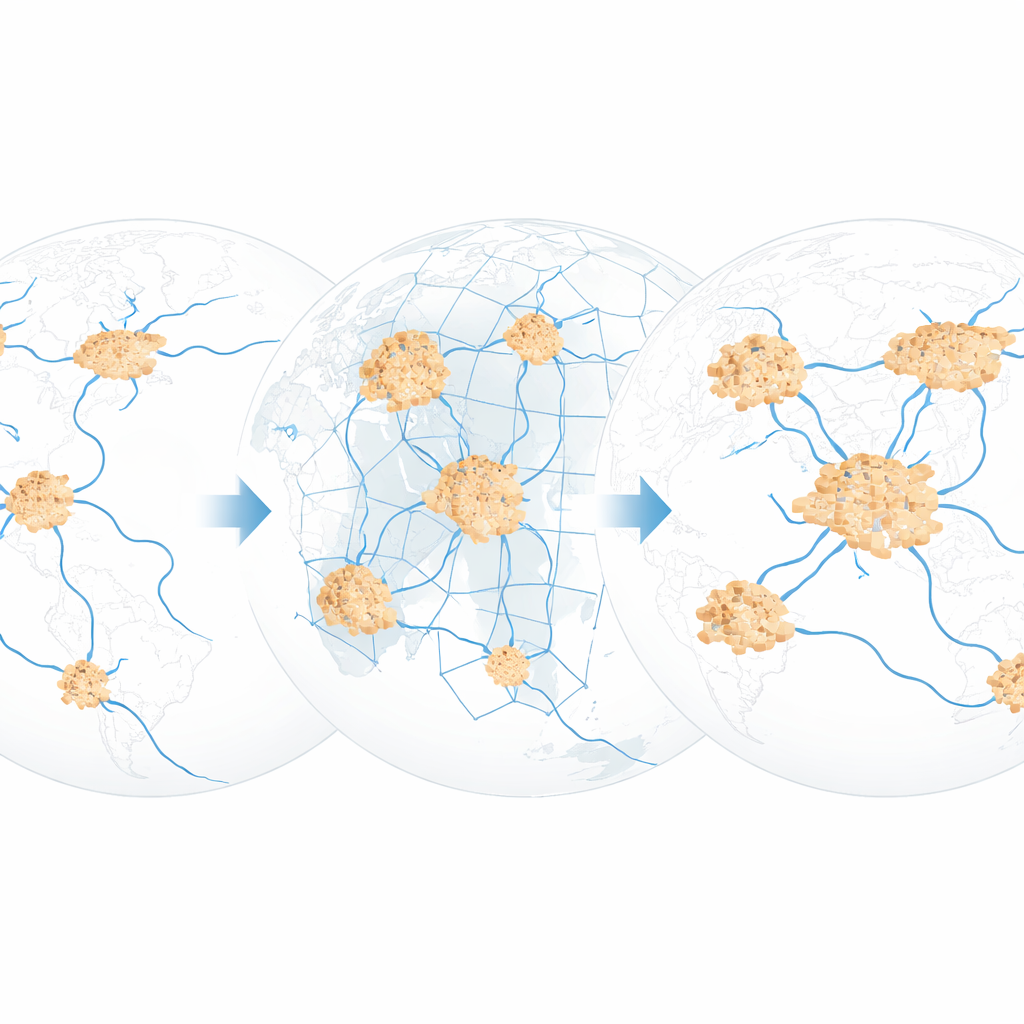
More than half of humanity already lives in cities, and that share is expected to rise to roughly two-thirds by mid-century. As people move into urban areas, their water demand becomes concentrated, making cities the focal points of global water stress. Past global studies tried to measure urban water scarcity in three main ways: by looking grid-by-grid at water supply and demand, by summing conditions across entire river basins, or by compiling case studies of documented water systems. Each of these approaches has blind spots. Grid-based models can exaggerate scarcity by ignoring how cities draw water from surrounding areas. Basin-wide views blur the fact that many cities tap several different rivers. And case-study maps only exist for a limited set of well-documented, often wealthier or larger, cities.
Drawing City Lines That Follow the Pipes
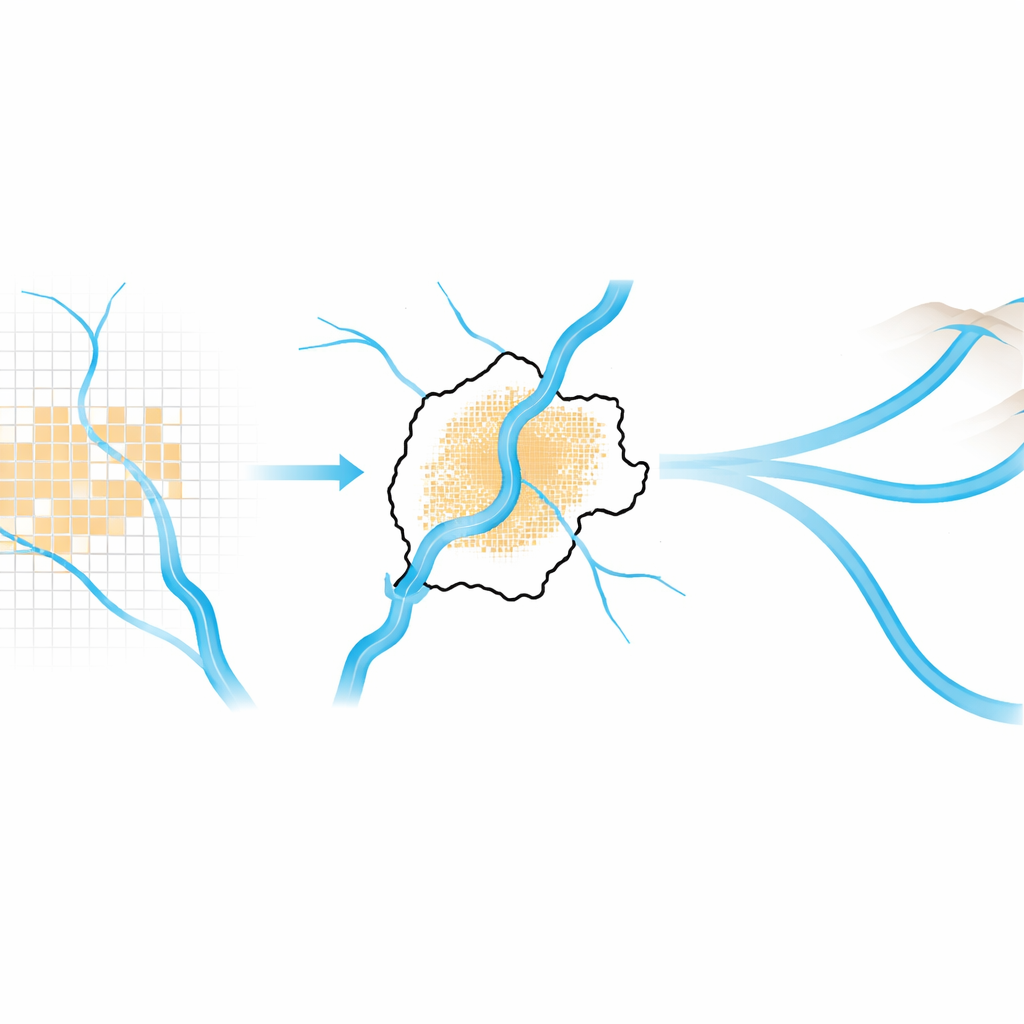
HUM tackles this problem by redefining what counts as part of a city for water studies. Instead of relying on a simple density cutoff or satellite images of built-up land, the authors start from official United Nations estimates of city populations, which reflect how countries themselves define urban residents for planning and service provision. They then use a global gridded population map to grow a “city mask” outward from the densest core until the people inside match the official city total. This procedure naturally includes suburbs and peri-urban areas where many households receive piped water and sewerage but would be missed by methods that only recognize tightly built city centers.
Linking Cities to Rivers Near and Far
Once these water-served city masks are drawn, HUM overlays them on a detailed global river network and elevation map. For each city, the authors identify the main river channels that cross the city area, then mark an upstream “inlet” point where water would most plausibly be taken in, and a downstream “outlet” where used water returns to the river. Recognizing that many cities depend on water imported from outside their immediate footprint, the team also searches surrounding terrain, up to about 100 kilometers away and at higher elevations, for river segments that could realistically feed aqueducts. These spots, called aqueduct origins, are not claims about existing pipes but about physically plausible external sources that could boost a city’s water availability.
Testing the New Map Against Reality
To see whether HUM’s picture of cities and their water sources is trustworthy, the authors run several checks. They show that, for most cities, the population contained inside the new masks matches official figures extremely closely, with only modest discrepancies arising from the coarse grid. Compared with satellite-based maps of built-up land, HUM’s city areas are usually larger, especially in regions where water and services spread far into low-density suburbs. When compared with a widely used density-threshold approach to defining “urban,” HUM consistently captures hundreds of thousands more people per city who are likely to be connected to water systems but would otherwise go uncounted. The team also compares HUM’s river inlets and external source points with a global database of real-world water facilities. While the estimated locations are not precise to the kilometer, they usually lie on the same river branches and capture the main upstream–downstream relationships that matter for water planning.
What This Means for Future Water Security
In plain terms, this work offers a better answer to a simple but crucial question: who and what is actually inside a city when we think about water? By mapping city boundaries in a way that follows water-served populations and their connected rivers, HUM allows scientists, planners, and policymakers to estimate how much water a city can draw, from where, and how that might change under drought or growth. It also highlights how one city’s choices can affect its neighbors through shared rivers and potential transfer schemes. For the general public, the message is that the safety of urban water supplies depends not just on the reservoir at the edge of town, but on a much wider web of rivers, hills, and communities. HUM turns that hidden web into a shared map, helping societies prepare more realistically for a thirstier urban future.
Citation: Kajiyama, K., Hanasaki, N. & Kanae, S. City boundaries for global urban water scarcity assessment. Sci Data 13, 657 (2026). https://doi.org/10.1038/s41597-026-06933-w
Keywords: urban water scarcity, city boundaries, water resources, river networks, global hydrology