Clear Sky Science · en
Characterizing spatiotemporal white matter hyperintensity pathophysiology in vivo to disentangle vascular and neurodegenerative contributions
Why bright spots in brain scans matter
As people grow older, many brain scans show small bright spots in the wiring that links different brain regions. Doctors usually treat these spots as signs of damaged blood vessels and use them to judge stroke or dementia risk. But new evidence suggests that some of these bright areas may instead reflect slow loss of nerve fibers linked to diseases like Alzheimer’s. This study asks a crucial question for patients and clinicians alike: when we see these spots on a scan, are we looking at blood vessel trouble, nerve cell degeneration, or a mix of both?
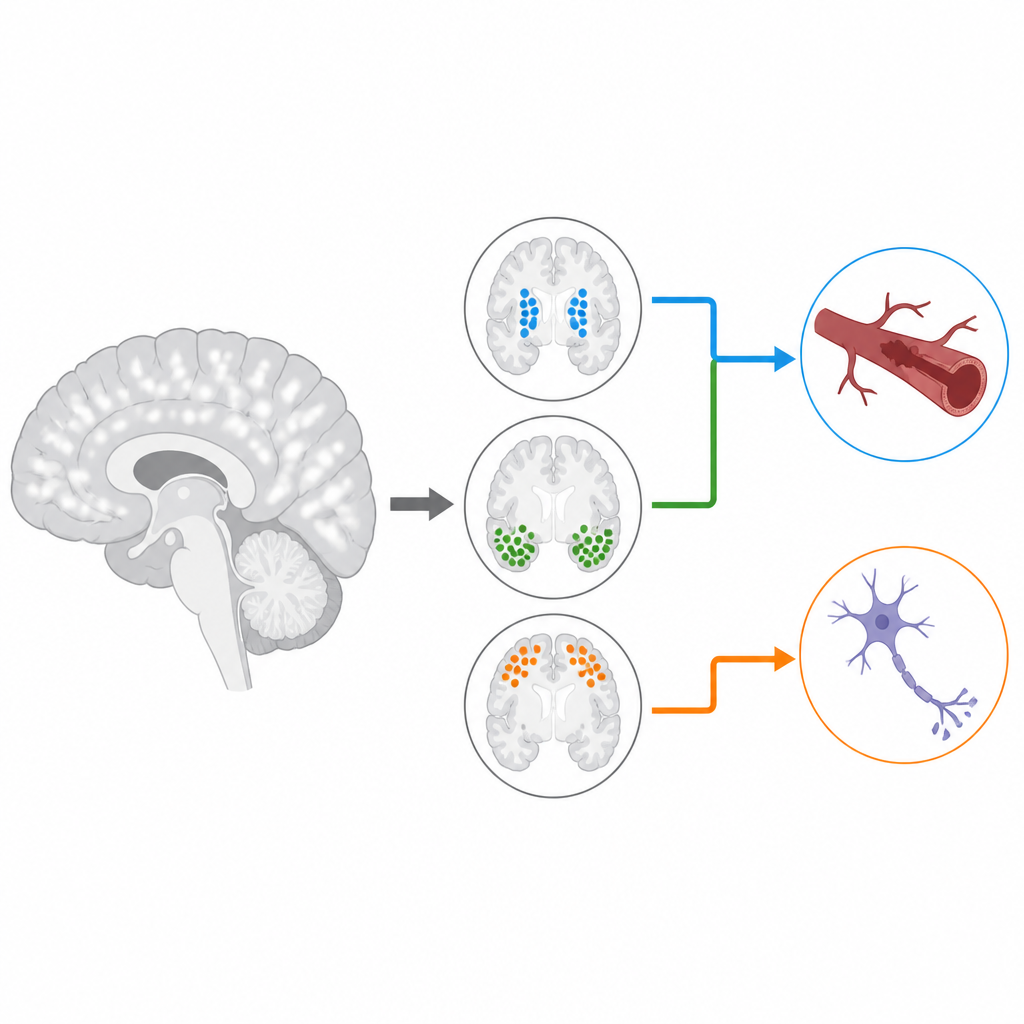
Different kinds of spots in different parts of the brain
The researchers analyzed brain scans from more than 32,000 adults in the UK Biobank and additional groups at risk for Alzheimer’s disease. They focused on white matter hyperintensities, the bright patches that show up on a common hospital MRI sequence. Instead of simply measuring how much bright area each person had, they built detailed maps of how the tissue within each patch differed from what would be expected for a healthy person of the same age and sex. These maps did not just count damage; they described changes related to water content, nerve fiber structure, and the insulating myelin around those fibers.
Three main neighborhoods of damage
Using these tissue maps, the team let the data group the bright spots into regions that behaved similarly, without telling the computer where to look. Three main clusters emerged. One hugged the fluid-filled spaces deep in the brain and showed only mild changes, likely including many harmless tiny spots. A second cluster sat toward the back of the brain, and a third was deeper and more toward the front. The back and front clusters both showed clear signs of injury, but the front regions tended to look more severely affected overall. These patterns were stable regardless of how many spots a person had or whether they were male or female, suggesting that location reflects different underlying processes rather than just stages of the same disease.
How damage unfolds over time
Because following tens of thousands of people over many years is difficult, the researchers used a machine learning method to reconstruct how the tissue changes likely unfold over time. Across regions, early changes were consistent with extra water and swelling in the tissue, followed by increasing disruption of nerve fibers and loss of myelin and iron-rich support cells. The front regions tended to reach more extreme levels of damage, while the back regions showed a pattern that hinted at more selective injury to nerve fibers themselves rather than just general water buildup.
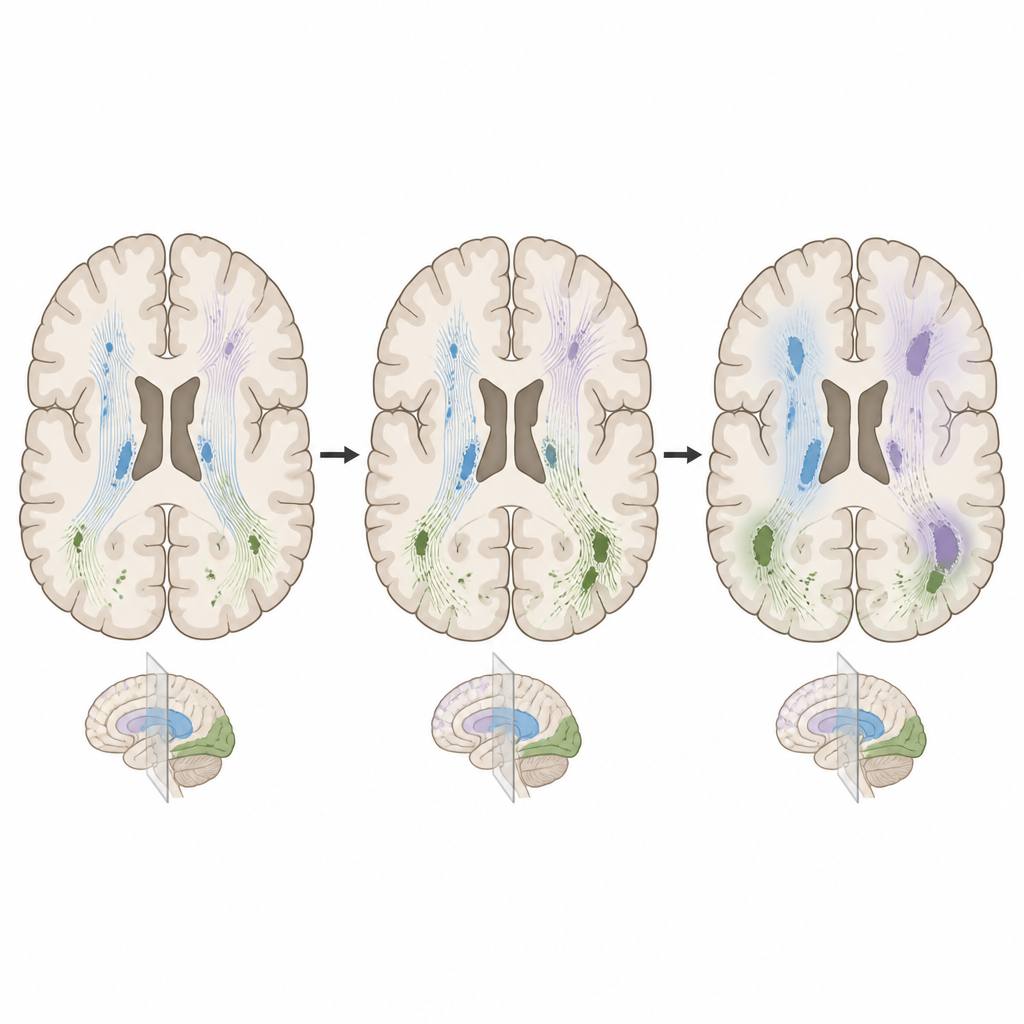
Vessel-related spots versus Alzheimer-related spots
To link these patterns to real diseases, the team compared people with stroke, heart disease, or dementia diagnoses, and also people with high inherited risk for cardiovascular disease, stroke, or Alzheimer’s. In vascular conditions and in those with high genetic risk for heart and stroke problems, the strongest abnormalities appeared in the deep front regions, fitting a blood vessel story. In contrast, people with dementia and those with high genetic risk for Alzheimer’s had more abnormal spots toward the back of the brain. There, the tissue changes suggested disorganized and selectively lost fibers rather than just fluid leakage. In a separate Alzheimer-focused dataset, this back-of-the-brain signature showed up again and was reproducible.
Connections to areas where toxic proteins build up
The scientists then asked where the affected white matter fibers go in the healthy brain. Using a detailed wiring diagram from young adults, they traced fibers passing through each cluster of bright spots to the surface of the brain. Fibers running through the back cluster were strongly connected to regions in the lower temporal and occipital lobes, areas known to accumulate the tau protein in the early stages of Alzheimer’s. In a separate group of at-risk but still cognitively normal volunteers, these same cortical regions showed high signals on tau scans, but not necessarily on amyloid scans. This suggests that the back-of-the-brain white matter changes may be closely tied to the spread of tau and the breakdown of connected nerve pathways.
What this means for patients and future care
This work shows that not all bright spots on brain scans are alike. Some clusters, especially deep in the front of the brain, appear more closely linked to blood vessel problems. Others, particularly in the back, seem to track the loss of nerve fibers connected to tau-rich brain regions in Alzheimer’s disease. By looking beyond the simple volume of these lesions and examining their tissue signatures and locations, clinicians may one day be able to tell whether a person’s spots mostly reflect vascular strain, neurodegeneration, or both. That distinction could guide treatment choices, help select patients for new therapies, and lead to more precise use of the information already hidden in routine MRI scans.
Citation: Parent, O., Alasmar, Z., Osborne, S. et al. Characterizing spatiotemporal white matter hyperintensity pathophysiology in vivo to disentangle vascular and neurodegenerative contributions. Nat Commun 17, 4623 (2026). https://doi.org/10.1038/s41467-026-70832-2
Keywords: white matter hyperintensities, small vessel disease, Alzheimer disease, brain MRI, tau pathology