Clear Sky Science · en
Water stress and its sensitivity to demands across the Contiguous United States
Why water stress matters to everyday life
Across the United States, many communities worry about running short of water for farms, homes, and power plants, especially as droughts and heat waves become more common. This study looks at how changes in the way Americans use water over the past decade have altered the risk of water shortages, county by county, across the lower 48 states. By tracing where conservation helped most—and where stress is still growing—it offers a clearer picture of how everyday choices and policy decisions can ease pressure on rivers, aquifers, crops, and ecosystems.
How the researchers measured local water pressure
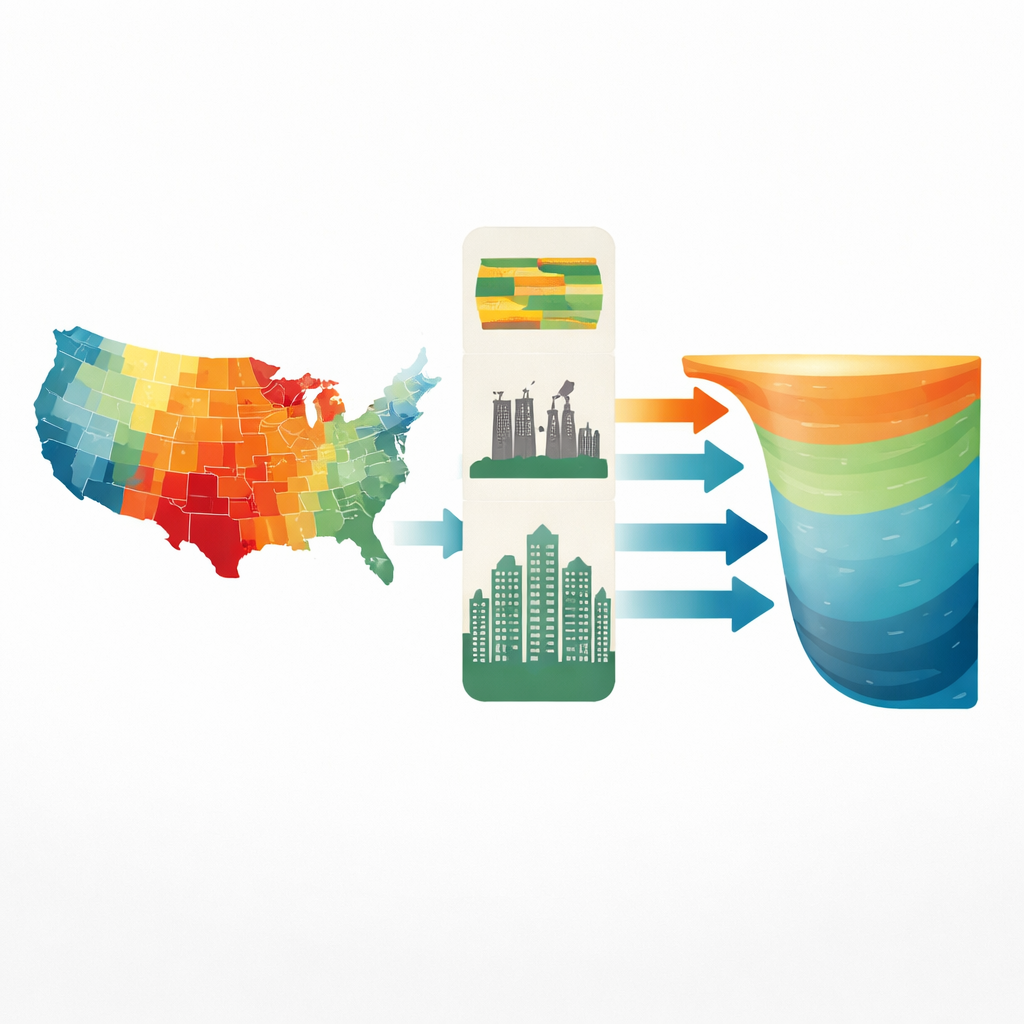
The authors combined over a century of weather data with detailed records of water demand from eight parts of the economy, including farms, power plants, cities, industries, and mines. For each U.S. county, they defined water “supply” as the share of local rainfall that realistically can be captured after normal losses to evaporation and runoff. “Demand” was built from crop water needs and official withdrawal statistics. They then tracked, day by day, when demand exceeded this renewable supply. A county was considered water stressed whenever these deficits pushed a running balance below zero, and the team recorded how long each stress episode lasted and how deep the deficit became. This allowed them to compare not just how often stress occurred, but whether it tended to be brief seasonal tightness or multi‑year strain that can damage ecosystems, crops, and infrastructure.
What changed between 2010 and 2020
Despite a 7.4 percent rise in population, total water demand across the contiguous United States actually fell by about 4.5 percent between 2010 and 2020. Most of this decline came from non‑agricultural uses such as power production and urban water systems, especially in New England and Atlantic states. Thermoelectric power plants, in particular, shifted away from water‑hungry coal units that use once‑through cooling toward facilities that withdraw far less water. At the same time, agricultural water demand dipped slightly overall, though it fell in many Central and Pacific states and rose in parts of the Mountain West and northern plains, where some high‑demand crops expanded. Because farming accounts for more than 80 percent of total demand in many regions, even modest shifts in crop area had noticeable impacts on local water use.
How conservation reshaped water stress patterns
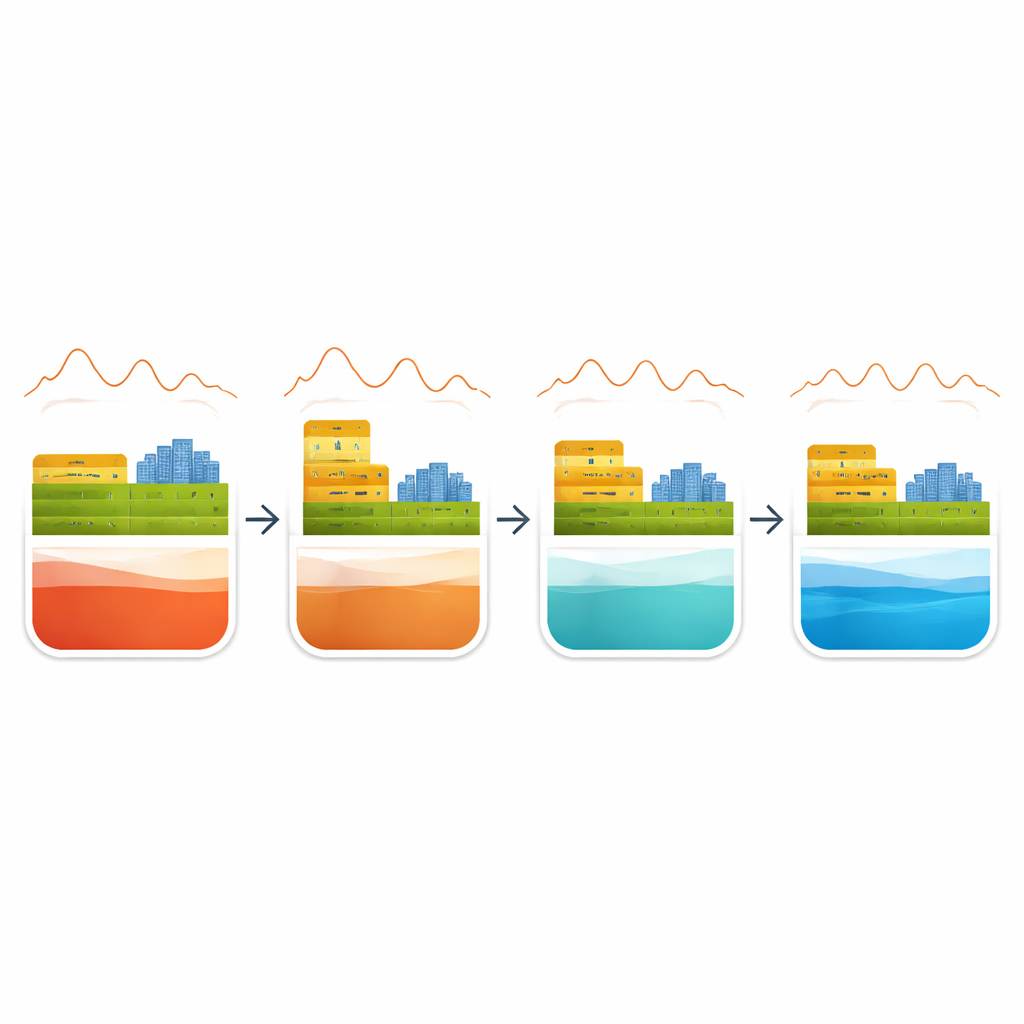
Lower demand translated into milder water stress across much of the country. On average, the expected length of stress episodes shrank by nearly 12 percent, and their average severity by about 14 percent. Fifty‑five counties that had been classified as chronically stressed—where multi‑year deficits build up and are hard to erase—moved into less severe categories. Improvements were especially strong in the agricultural heartlands of the Central states and in parts of California, where reductions in thirsty crops helped. New England and many Atlantic states benefited mainly from cuts in power‑plant and urban water use. Yet not all news was positive: in several Mountain and Northern Pacific states, and in some fringe farming areas of the Central region, rising agricultural demand led to more frequent or more severe stress, raising concerns for major grain‑producing areas that underpin national food security.
Which sectors matter most where you live
To see where conservation in each sector packs the biggest punch, the team ran “leave‑one‑out” experiments, recalculating stress after virtually removing one type of water use at a time. They found that cutting thermoelectric demand often produced the greatest reduction in stress per unit of water saved, while agricultural demand had the broadest geographic influence. Public and domestic supplies were also powerful levers in densely populated regions. The strength of these effects depended on local conditions: places with high demand but limited rainfall were very sensitive to demand cuts, whereas wetter regions were less so. Climate features such as temperature, variability in rainfall, and how the timing of rain lines up with peak use further shaped these sensitivities, showing that local climate and sector mix together determine which conservation strategies will be most effective.
What this means for future water planning
The study concludes that recent conservation efforts have measurably reduced both the duration and severity of water stress across much of the United States, even as the population grew. However, many farming belts and power‑generation hotspots remain structurally vulnerable, often relying on groundwater or imported water that can be disrupted during prolonged droughts. By pinpointing which sectors drive stress in each county, and how that depends on local climate and demand patterns, the findings give planners, utilities, and communities a practical guide for where to focus limited conservation dollars. In simple terms, smartly targeted savings in farms, power plants, and public systems can turn the tide on water stress in many regions—but without continued planning and adaptation, key food‑producing and energy‑producing areas may still face chronic strain in a warming, thirstier world.
Citation: Kim, SH., Devineni, N. Water stress and its sensitivity to demands across the Contiguous United States. Commun. Sustain. 1, 65 (2026). https://doi.org/10.1038/s44458-026-00072-4
Keywords: water stress, water conservation, agricultural water use, thermoelectric power, United States drought