Clear Sky Science · en
Minimally supervised learning on sub-meter satellite imagery reveals slum expansion during the COVID-19 pandemic
Why city shadows matter
Across the world, hundreds of millions of people live in crowded neighborhoods with fragile homes and poor access to water, sanitation, and services. These communities are often invisible in official statistics, making it hard for governments and aid groups to plan support or track progress toward global goals. This study shows how modern satellite images and artificial intelligence can reveal how such settlements grow and change over time, including during shocks like the COVID-19 pandemic and in response to city redevelopment projects.
Seeing hidden neighborhoods from space
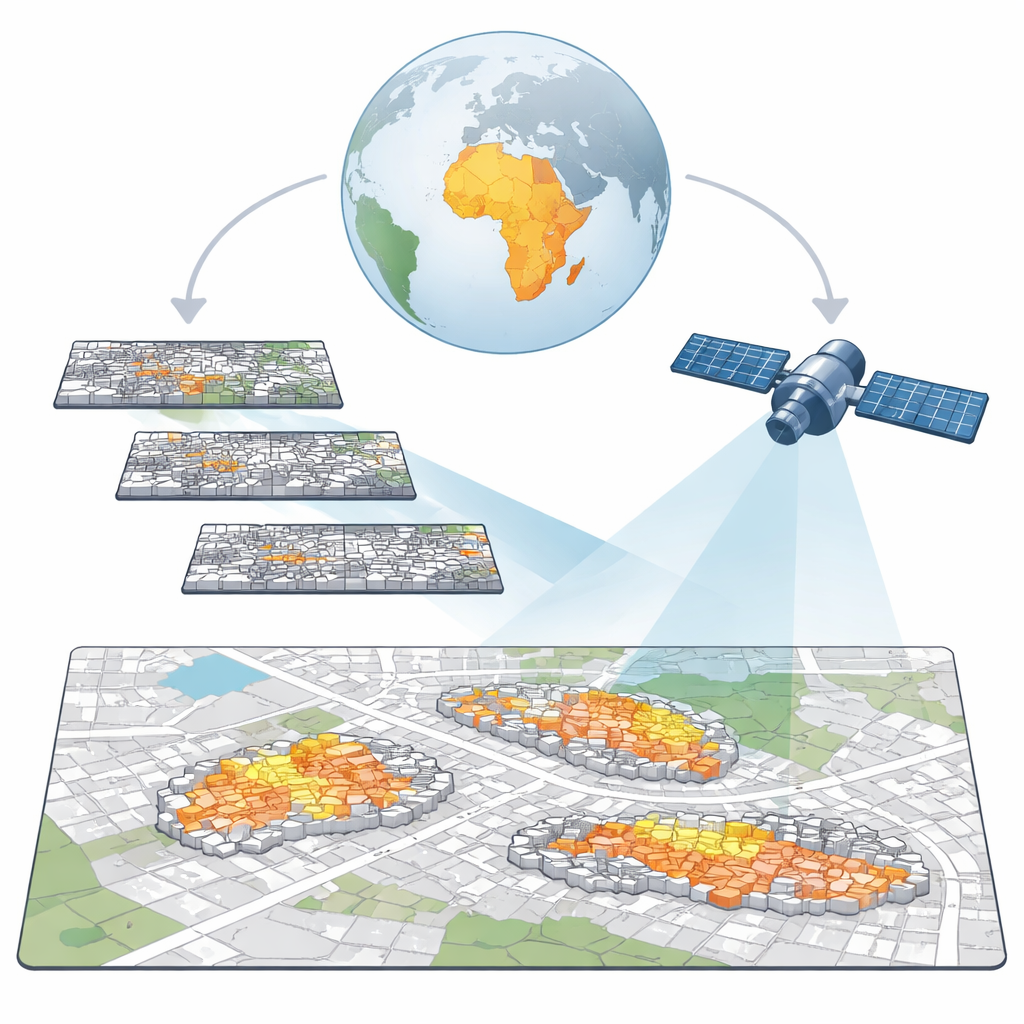
The authors focus on slums, or deprived urban settlements, where residents face insecure housing and limited basic services. Traditional ways of counting slum dwellers rely on household surveys, which are expensive, slow, and rarely detailed enough to show what is happening within a city. New high-resolution satellites, however, can pick up fine details such as roof shapes, building density, and the tight maze of streets that often signal informal housing. The challenge is to turn this flood of image data into reliable, large-scale maps without spending years hand-labeling every pixel.
Teaching computers with very few examples
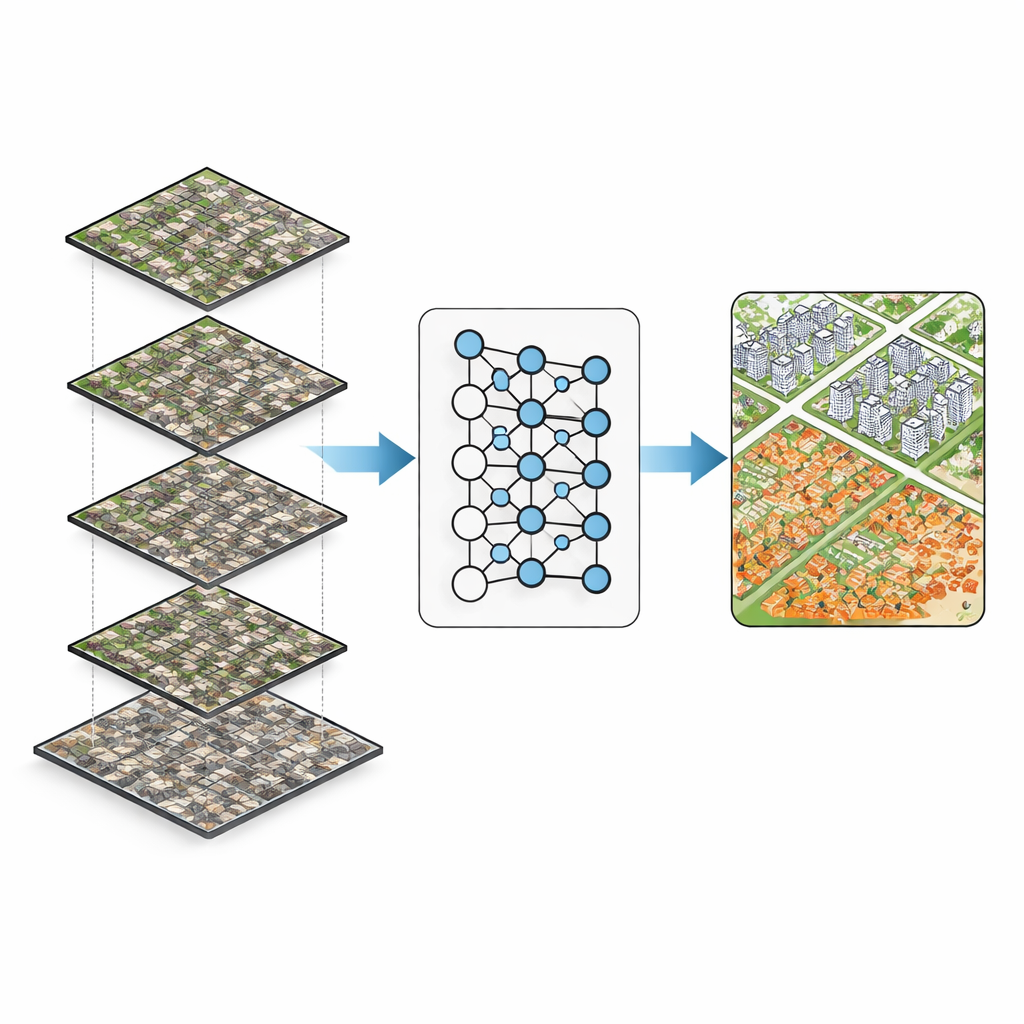
To solve this, the researchers built a computer vision system called SegSlum that learns to recognize informal settlements from satellite photos where each pixel represents about 60 centimeters on the ground. Instead of requiring exhaustive human labeling, they used a “minimally supervised” approach: experts carefully labeled a relatively small set of images—about 3% of their full dataset—and the model then taught itself on millions of unlabeled images. It did this in two main steps. First, an initial model learned from the labeled examples while being forced to ignore superficial changes in lighting or color between images. Then, this model created tentative labels on the unlabeled images; a second model retrained on only the most reliable of these, filtering out unstable guesses. This allowed the system to adapt to different cities, seasons, and satellite sensors while keeping errors in check.
Tracking change across cities and years
Using SegSlum, the team analyzed nearly 2.8 million satellite image tiles from 12 large cities in Africa, Asia, and Latin America between 2014 and 2024. The model proved highly accurate, closely matching detailed ground maps of slums and outperforming more conventional supervised models. With this tool, the researchers could estimate how the share of urban land covered by slums changed over time, even month by month. Contrary to global statistics from UN-Habitat, which suggest a slow decline in slum prevalence, the satellite-based results showed a slight overall increase in slum area in these cities over the decade, and a clear uptick in nine out of twelve cities during the COVID-19 lockdown period. By combining the maps with population grids and data on hospitals, schools, and other facilities, they also found that more people were living in these areas while average access to basic services within them was getting worse.
Unintended effects of “improvements”
The study also looked at what happens around major development projects. In two cities—Ulaanbaatar and Cape Town—authorities launched programs specifically aimed at upgrading slum areas, for example by replacing fragile homes with sturdier housing or renovating roofs. SegSlum’s maps showed that while conditions improved inside project sites, nearby informal settlements actually expanded, sometimes up to several kilometers away. This suggests that better roads, utilities, and public housing can attract new low-income residents to the surrounding fringe, spreading informality rather than eliminating it. In contrast, large transport or real-estate projects in Nairobi and Mumbai that did not aim to share benefits with existing residents did not show the same kind of local spillover growth, although they may have pushed people to more distant, unobserved areas.
Linking roofs to poverty
Because SegSlum produces a score for how strongly an area looks like an informal settlement, the authors tested whether these scores line up with independent measures of poverty, such as national wealth surveys and official poverty headcounts. In most of the cities where such data were available, the slum scores correlated more strongly with deprivation than widely used satellite-based economic indicators like night-time lights. This means that, although the method cannot see every dimension of hardship, it can help flag neighborhoods that are likely struggling, supporting more detailed on-the-ground assessments.
What this means for future cities
For non-specialists, the key takeaway is that we can now use routine satellite imagery and relatively light human effort to create detailed, regularly updated maps of informal settlements across the globe. These maps reveal that slum areas in the studied cities have not been shrinking and that, during the COVID-19 crisis, they often grew while access to services fell. They also show that even well-intended upgrade projects can have side effects, shifting poverty rather than removing it. While the method has limits—it mainly sees what roofs and walls reveal, not invisible issues like water quality or tenure rights—it offers a powerful new lens on urban inequality. Used carefully and ethically, such tools could help planners and communities monitor vulnerable neighborhoods, design more inclusive policies, and check whether city investments truly improve lives rather than just moving hardship out of sight.
Citation: Yang, J., Park, S., Kim, H. et al. Minimally supervised learning on sub-meter satellite imagery reveals slum expansion during the COVID-19 pandemic. Commun. Sustain. 1, 52 (2026). https://doi.org/10.1038/s44458-026-00054-6
Keywords: slum mapping, satellite imagery, urban poverty, deep learning, informal settlements