Clear Sky Science · en
Global ammonia emission inversion in 2022 via assimilating IASI observations
Why farm air matters to everyday life
Invisible gases from farms and fires can quietly shape the air we breathe, our climate, and even how long we live. One of the most important of these gases is ammonia, which is released when fertilizers are spread, animals are raised, and vegetation burns. Once in the air, ammonia helps form tiny particles that can lodge deep in our lungs. This study uses satellites and computer models to build a sharper global picture of where ammonia is coming from, with a special focus on South America and Africa, regions that have long been data blind spots. 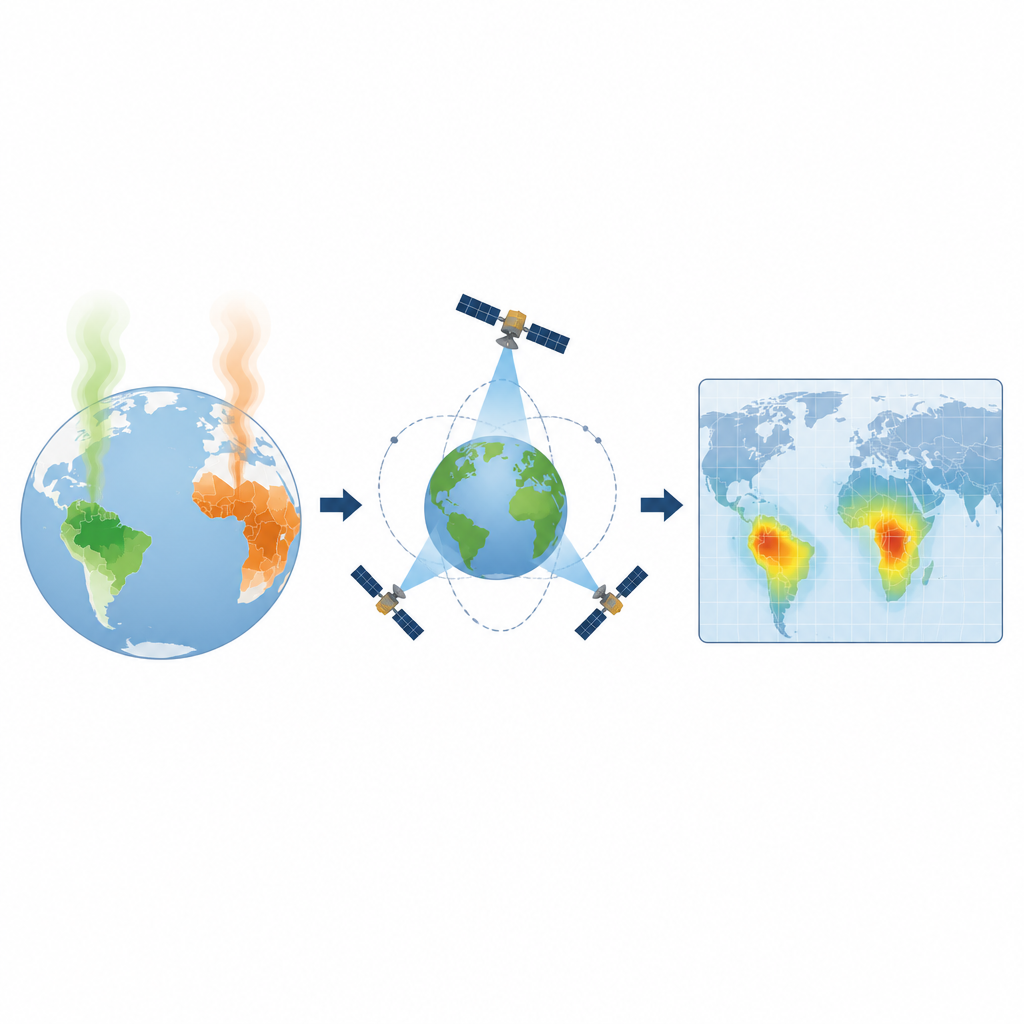
The hidden gas in farm fields and smoke
Ammonia is a basic gas that reacts with acidic pollutants from cars, power plants, and industry to form fine particulate matter. These particles contribute to smog and haze and are linked to asthma, heart disease, and shorter life expectancy. Most ammonia today comes from agriculture, especially fertilizers and livestock waste, with smaller amounts from industry, household fuel use, and vehicles. To understand its impacts, scientists rely on emission inventories that estimate how much ammonia is released in each place and month. However, these estimates are built from the ground up using farm statistics and standard emission factors, which are often uncertain or missing in less monitored regions.
Why traditional estimates fall short
Conventional global inventories tend to work best in North America and Europe, where farm practices are well documented and monitoring networks are dense. In contrast, they struggle in South America and Africa, where fertilizer use, animal numbers, and burning practices can change quickly and are poorly recorded. Earlier attempts to improve inventories often used simple mass-balance methods that adjusted emissions so that modelled air concentrations matched observations. These methods have trouble with the messy reality of the atmosphere, where ammonia release depends in a nonlinear way on temperature, humidity, and wind, and where pollution can drift far from its source. As a result, they can misplace emissions and miss important seasonal swings.
Using satellites to rewrite the ammonia map
The authors built a global inversion system that blends satellite observations with an atmospheric chemistry model to update the worldwide ammonia inventory for 2022. They used data from the Infrared Atmospheric Sounding Interferometer, a spaceborne sensor that measures ammonia high above Earth twice a day, and fed these measurements into the GEOS-Chem model using a modern data assimilation technique known as four-dimensional ensemble variational analysis. This approach searches for the pattern of emissions that best fits both the satellite data and prior estimates, while respecting how winds, chemistry, and removal processes move and transform ammonia in the air. 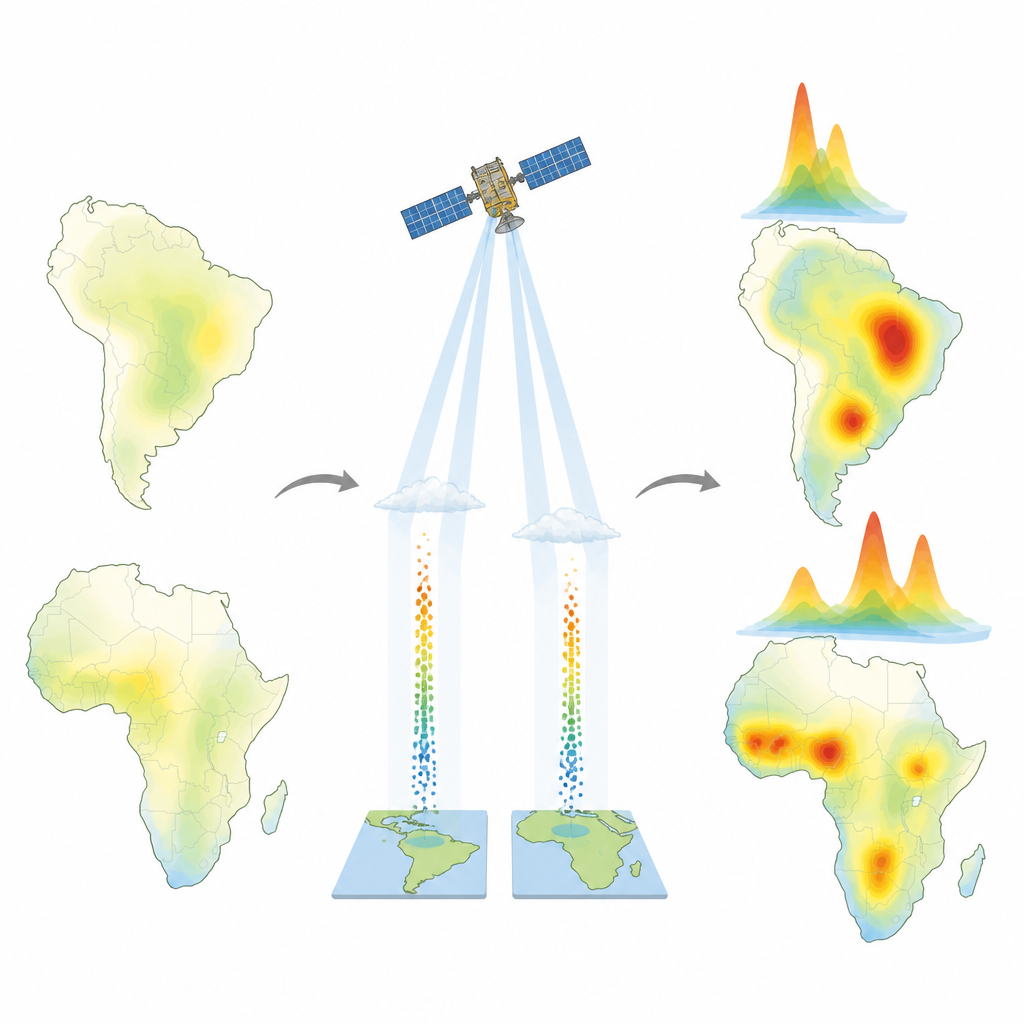
What changed in South America and Africa
The revised, or posterior, emissions tell a different story from the prior inventory. Over South America, hotspots over Brazil and nearby coastal regions become far stronger, with ammonia fluxes often doubling and sometimes increasing by 100 to 200 percent compared with earlier estimates. The new patterns line up closely with satellite indicators of fire intensity and with known growth in poultry production, suggesting that both burning and livestock play key roles. In Africa, three belts of high emissions stand out: coastal West Africa, the Lake Victoria region, and Ethiopia. Here, the updated emissions reach more than twice the prior values and show clear seasonal peaks that track cocoa fertilization cycles, rainy-season soil activity, livestock waste, and shifting fire seasons across the savannas.
Sharper concentrations and steadier long-term trends
When the updated emissions are fed back into the model, simulated ammonia columns match satellite observations much more closely in both space and time. The model now captures strong seasonal patterns, such as the double peak over South America and the migration of African hotspots as the dry season moves south. Independent checks using a second satellite instrument and ground-based particle measurements support the improvements, especially in South America. Looking back over a decade of satellite data, the team finds that average ammonia levels in these regions have risen modestly but steadily, with localized hotspots intensifying, yet without dramatic continent-wide shifts.
What this means for air and climate policy
For non-specialists, the key message is that previous maps understated how much ammonia is released in parts of South America and Africa, and how strongly these emissions vary with season and land use. By harnessing satellites and advanced modeling, this work delivers a more realistic global picture of ammonia sources, particularly from agriculture and fires in regions with few ground measurements. Such refined inventories are crucial for designing effective air quality and climate policies, targeting fertilizer use and livestock management, and understanding how changes in farming and burning practices ripple through the atmosphere and affect human health.
Citation: Chen, M., Zhang, W., Han, W. et al. Global ammonia emission inversion in 2022 via assimilating IASI observations. npj Clean Air 2, 35 (2026). https://doi.org/10.1038/s44407-026-00072-7
Keywords: ammonia emissions, satellite observations, South America, Africa, air quality