Clear Sky Science · en
Characterization and forecast of global influenza subtype dynamics
Why the mix of flu strains matters
Every winter, we hear that “the flu is going around,” but that flu is not a single virus. Several related strains circulate together, and which one dominates can change how many people fall ill, which age groups are hit hardest, and how well vaccines and hospitals can cope. This study looks at more than two decades of worldwide lab data to understand how the main influenza strains take turns around the globe—and how that hidden pattern can be used to better anticipate next year’s flu season in each country.
Following the changing face of the flu
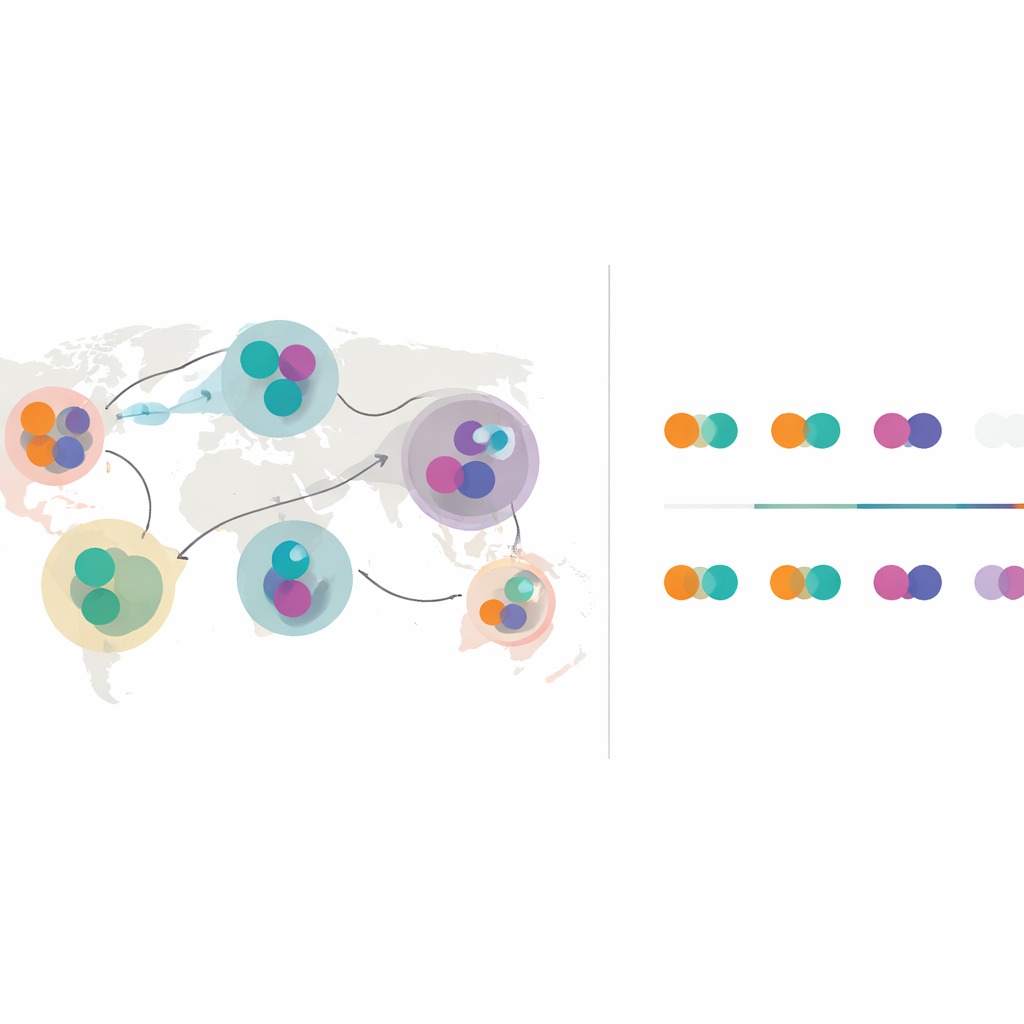
The authors focused on three key forms of seasonal flu: two versions of influenza A (often called H1N1 and H3N2) and influenza B. Instead of counting raw case numbers, which vary greatly between countries and years, they examined the percentage share of each strain in every country-year from 2000 onward using data from the World Health Organization’s FluNet system. Because those percentages must always add up to 100%, they applied a mathematical approach known as compositional data analysis, which turns the three-way mix into points on a two‑dimensional map. Each country’s journey across that map over time becomes a trajectory showing how its local balance of strains shifts from year to year.
Years when one strain takes over
By tracking these trajectories, the team created a simple “mixing score” that measures whether a country’s flu season is shared fairly among strains or dominated by a single one. Most years showed a blend of strains, but a few stood out: in 2003 a particular H3N2 variant swept the world; in 2009 the newly emerged pandemic H1N1 strain took over; and during 2020–2021, under COVID‑19 travel and contact restrictions, different strains dominated in different regions rather than mixing globally. These exceptional years showed how sudden viral changes or shifts in human behavior can tilt the balance of strains, with knock-on effects such as changes in which age groups are most affected and even the disappearance of some lineages.
How geography and travel shape flu patterns
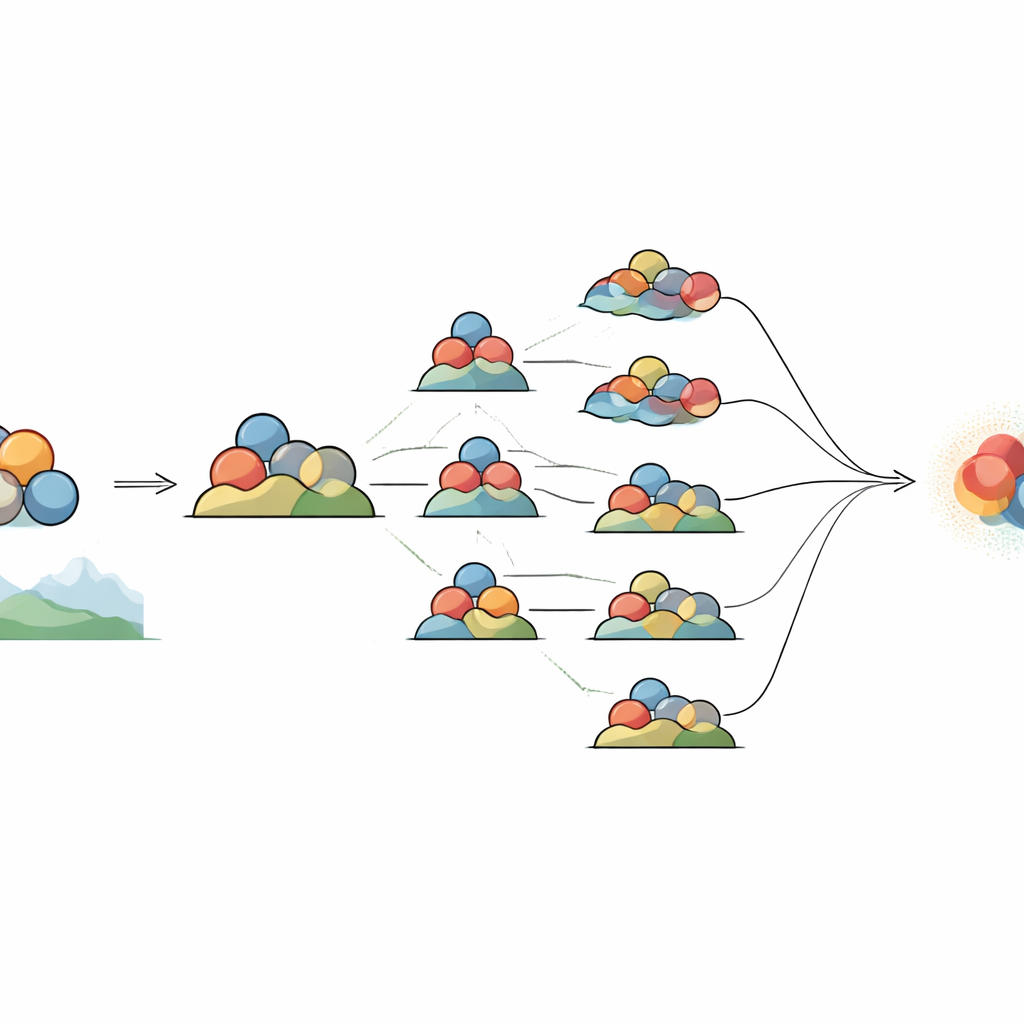
To understand why countries’ strain mixtures resemble one another, the researchers compared the distance between their trajectories with differences in climate, timing of flu seasons, and air travel links. Countries with similar temperatures and humidity, overlapping flu seasons, and especially heavy air traffic between them tended to show similar strain histories. When they grouped countries purely by how their strain mixes changed over time, two broad clusters emerged. One cluster—mainly Europe, North Africa and West Asia—showed a striking, synchronized alternation of the two influenza A strains from year to year. The other cluster, including many tropical nations plus North America and East Asia, showed more persistent mixing and less tight year‑to‑year alternation.
Teaching models to look at the whole world
The team then asked whether these patterns could help predict the strain mix for the following year in each country. They compared five forecasting approaches, ranging from very simple “repeat the past” rules to more sophisticated statistical time‑series models. The most advanced approach, a hierarchical vector autoregressive model, pooled information from countries with similar strain histories instead of treating each country in isolation. This global, cluster‑aware model outperformed simpler methods when judged on how well it anticipated which strain would dominate or be nearly absent, especially for the regions with strong alternation patterns.
What this means for preparing for flu seasons
The study shows that the global flu landscape hides a clear structure shaped by climate, international travel and shared epidemic timing. By expressing strain mixes in a way that modern statistical tools can handle, the authors reveal that countries fall into a few broad pattern groups and that these groups can be used to sharpen one‑year‑ahead forecasts. Although predictions are far from perfect and break down during upheavals like the COVID‑19 pandemic, this framework moves public health planning beyond guessing. It offers a way to use worldwide data to anticipate which strain is more likely to dominate next year in a given place—information that can help guide vaccine planning, hospital preparedness and communication with the public.
Citation: Bonacina, F., Boëlle, PY., Colizza, V. et al. Characterization and forecast of global influenza subtype dynamics. Nat. Health 1, 390–402 (2026). https://doi.org/10.1038/s44360-026-00069-2
Keywords: seasonal influenza, virus subtypes, global surveillance, air travel and disease spread, epidemic forecasting