Clear Sky Science · en
Resilience of urban metro rail networks globally guided by mesoscale and connectivity attributes
Why subway resilience matters to everyday life
Subway and metro systems are the hidden veins of modern cities, quietly moving millions of people to work, school, hospitals, and shops every day. When a few key stations fail—because of floods, power outages, accidents, or attacks—the effects ripple far beyond delayed commutes. Emergency response slows, businesses lose customers, and whole neighborhoods can feel cut off. This study asks a simple but powerful question: what is it about the physical layout of a city’s metro map that makes it bounce back quickly from trouble—or fall apart fast?
Looking at metro maps around the world
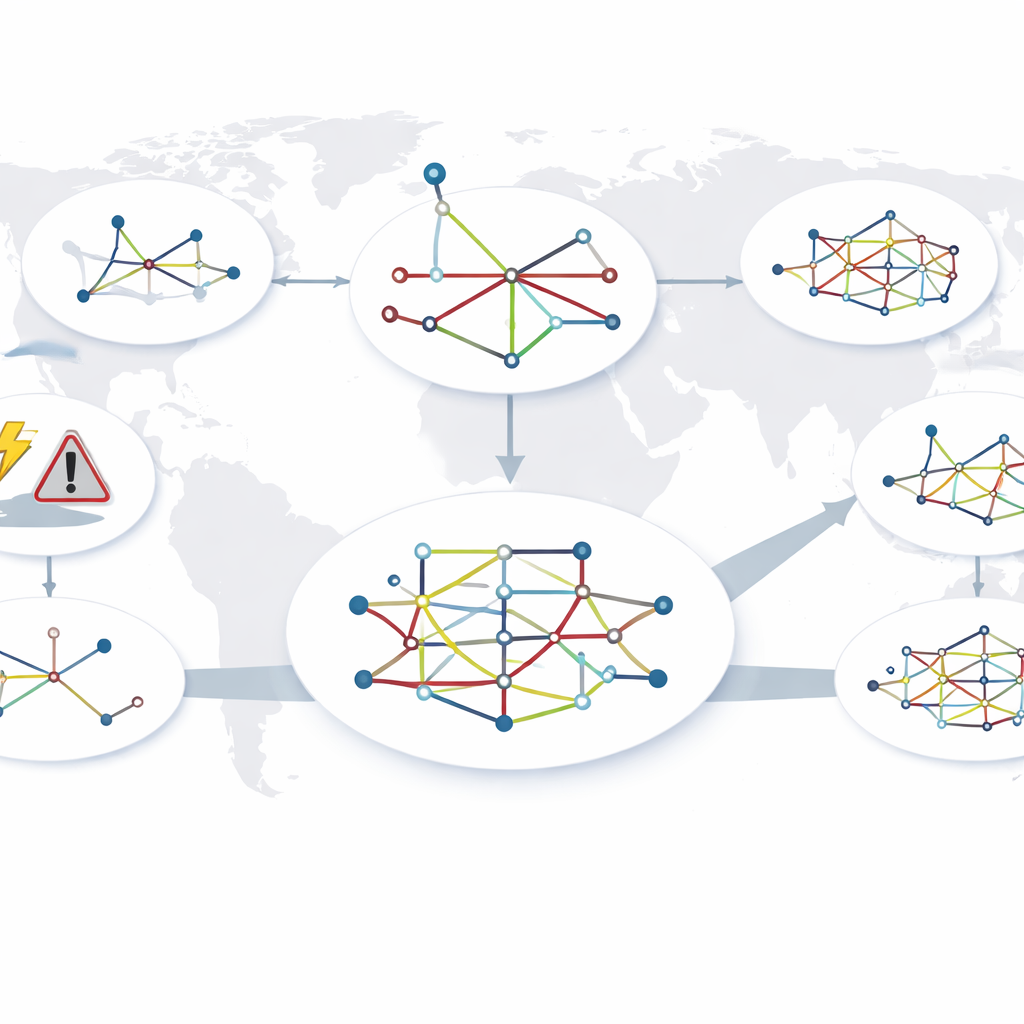
The researchers assembled a global picture of 45 urban metro rail systems spread across five continents, from giants like Tokyo, New York, and Delhi to smaller systems like Boston and Warsaw. They treated each metro as a network: stations are dots (nodes) and tracks between them are lines (edges). Instead of focusing on passenger counts or daily operations, they zeroed in on the shape of the network itself—how many stations there are, how they are connected, how many alternate routes exist, and whether the map is organized into tight clusters or more evenly spread webs. They measured 25 such structural features, grouped into themes like size and connectivity, redundancy, and how unequal or hub‑dominated the network is.
Stress-testing subways with virtual disruptions
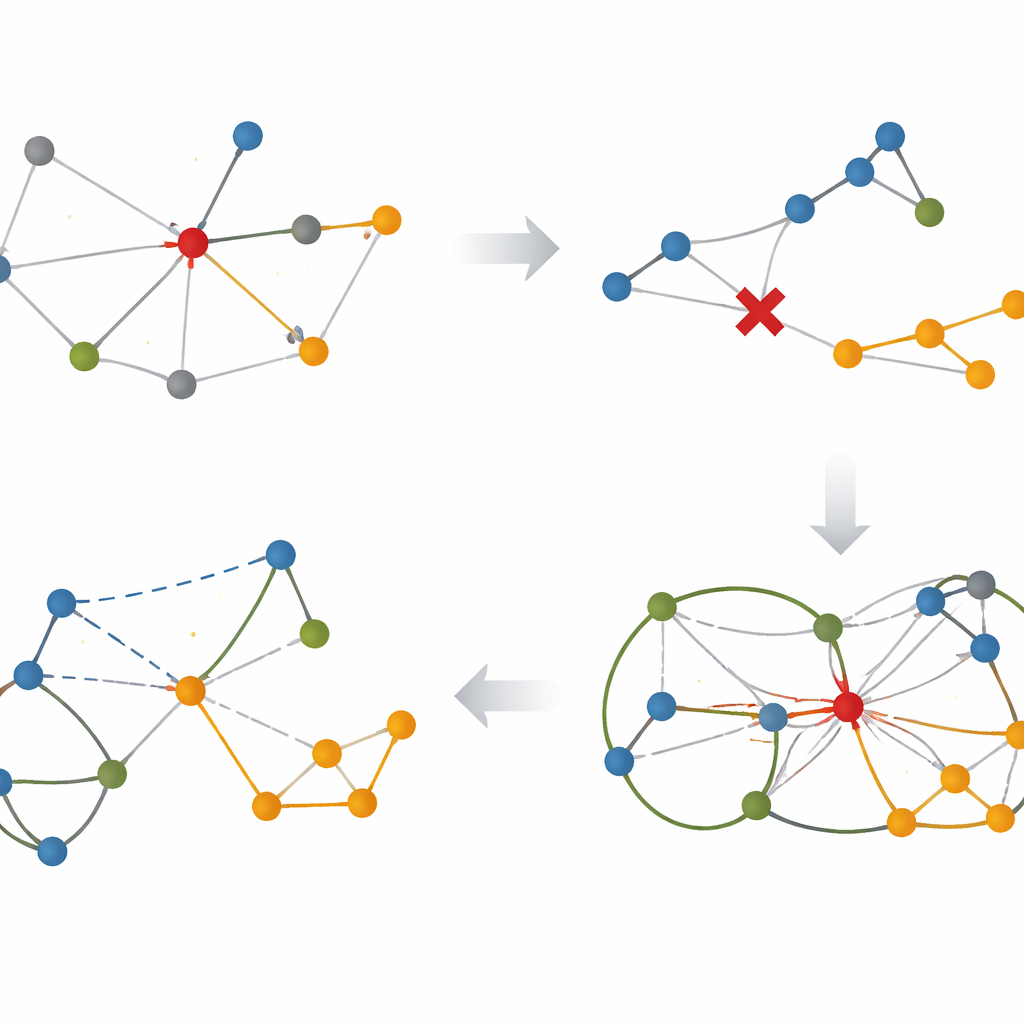
To see how these networks behave under stress, the team ran computer simulations that mimic station outages and later repair. In the failure phase, stations are “removed” one by one according to different rules: some scenarios knock out the most important hubs first, others remove stations randomly, and a special “greedy” strategy always chooses the next station whose loss hurts the network the most. In the recovery phase, the process runs in reverse—stations are brought back in various strategic orders. At each step, the researchers tracked how much of the network remained connected, using the size of the largest still‑connected cluster of stations as a stand‑in for how usable the system is. They then summarized overall performance with a score that captures how much connectivity is preserved during failure, or how quickly it is restored during recovery.
What makes some networks tougher than others
The global comparison revealed that not all ways of attacking a network are equally harmful, and not all layouts are equally fragile. Strategies that deliberately target stations lying on many routes (high “betweenness”) or exploit a sophisticated dominance ranking tended to break networks apart faster than random failures. The most resilient systems shared a set of structural traits: they were denser, had more direct links, and offered multiple paths around key stations. Networks with many loops and less rigid separation into distinct clusters were better at maintaining connectivity, because passengers could reroute when a hub went down. By contrast, when a system depends heavily on a few transfer stations that sit between otherwise separate branches, losing those hubs can quickly split the map into isolated islands.
How recovery depends on variety and loops
When the focus shifted from damage to repair, a different pattern emerged. Fast recovery was linked less to overall size and more to inequality and variety in how stations are connected. Networks where some stations had slightly higher degrees of connection—but without a few extreme super‑hubs dominating—could be re‑stitched more efficiently. Adding or restoring links that create loops and cross‑connections between lines helped reconnect stranded clusters and speed up the return of usable paths. In other words, smartly placed redundancy and a balanced mix of more and less connected stations support faster healing after a disruption, even if the network was badly fragmented at its worst point.
Turning theory into changes on a real map
To show that these patterns are not just abstract math, the researchers applied their insights to a real system: the Boston metro. Using the same global rules, they identified where a small number of new track links could most improve Boston’s robustness and recovery. One set of links bypassed overburdened central hubs by connecting outlying segments directly; another formed a compact loop in the core network. In simulations, these targeted changes preserved about 11 percent more performance during severe, targeted failures and sped up recovery compared with adding the same number of links at random. Crucially, the suggested links correspond to plausible, geographically grounded expansions rather than unrealistic crisscrosses of track.
What this means for future city transit
For non‑specialists, the message is clear: the way a metro map is drawn has a big influence on how a city weathers shocks. Networks that spread out risk across many routes, add sensible loops, and avoid over‑reliance on a handful of transfer stations are better at keeping people moving when things go wrong and at bouncing back afterwards. Because the methods rely mainly on the layout of stations and tracks, they can be applied quickly and cheaply, even in cities that lack detailed ridership data. This gives planners and policymakers a practical toolkit to identify weak spots, design smarter expansions, and retrofit existing systems so that everyday travel—and emergency mobility—remains reliable in an era of growing environmental and security threats.
Citation: Mukherjee, O., Zhou, D., Pal, A. et al. Resilience of urban metro rail networks globally guided by mesoscale and connectivity attributes. npj. Sustain. Mobil. Transp. 3, 31 (2026). https://doi.org/10.1038/s44333-026-00100-9
Keywords: urban metro resilience, transport networks, infrastructure robustness, public transit planning, network science