Clear Sky Science · en
Climate extremes and urbanization drive flood tipping points at the city–river interface
Why this flood story matters to city life
In late summer 2021, the remnants of Hurricane Ida turned parts of Philadelphia into a temporary lake, pushing the Schuylkill River to nearly 100 times its normal flow. This study takes a microscope to that disaster, using a street-by-street computer model to reveal how intense rain, a swollen river, ocean tides, and the shape of the city itself combine to create dangerous floods. The findings offer a warning—and a guide—for residents, planners, and policymakers in riverfront cities worldwide that face stronger storms and rising seas.
How a city river became a flood machine
The Schuylkill River slices through Philadelphia on its way to the Delaware River and the Atlantic Ocean. Over two centuries, people straightened its channel, built levees, and lined its banks with rail lines, highways, museums, hospitals, and dense neighborhoods. These changes allowed the city to grow but also cut the river off from its natural floodplain, where high water once spread out more safely. Long-term records show the river’s peak flows have increased much faster than its average flow, and the biggest floods are shifting from spring snowmelt to late-summer storms like Ida—signs of a changing climate.
Seeing Ida’s flood in fine detail
To understand what happened during Ida, the researchers built a high-resolution flood model that resolves individual streets and blocks. They fed it laser-based elevation data, detailed river depth measurements, land cover maps, rainfall records, and tidal levels. The model tracks how water depth and speed evolve as rain falls, runoff flows downhill, the river rises, and tides push in from downstream. When they compared the simulations with satellite images, river gauges, and drone photos from social media, the match was striking: the model captured which rail yards, parks, roads, and business districts actually went underwater.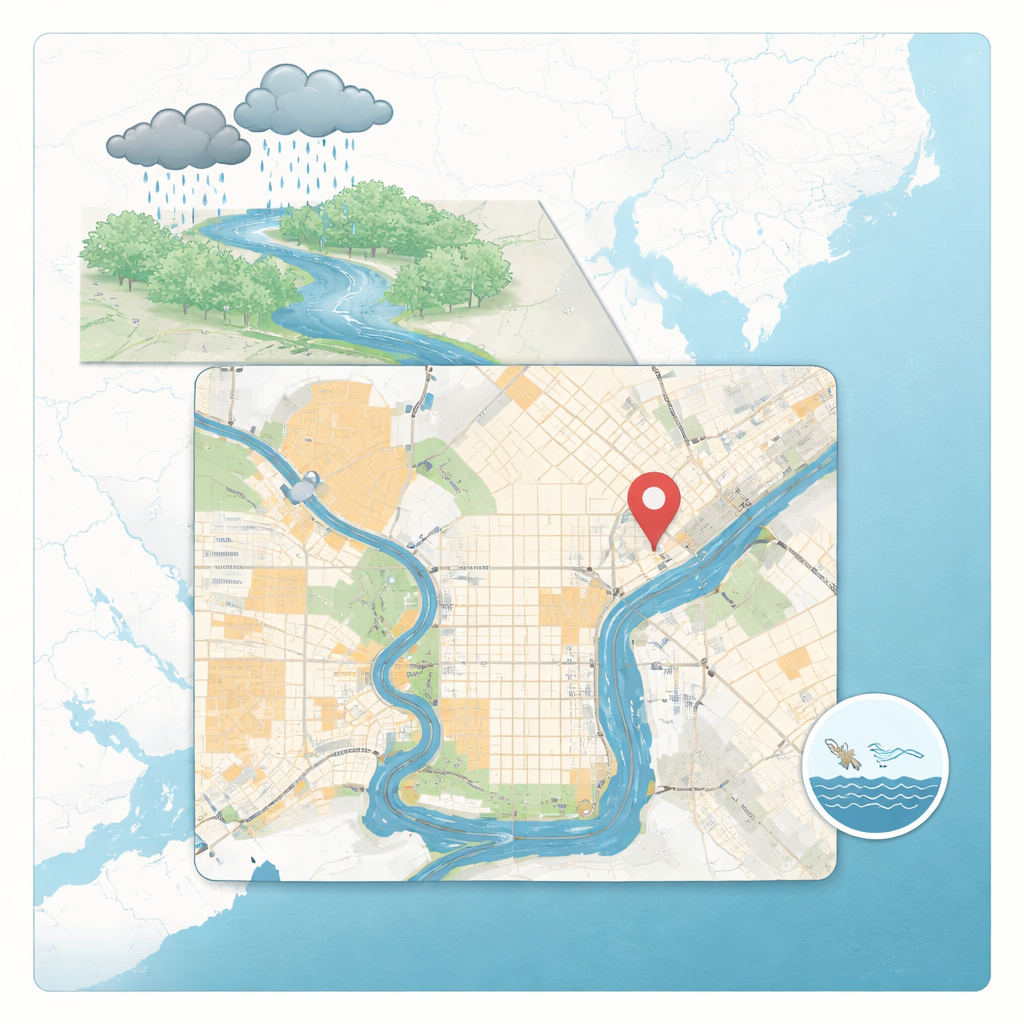
When pavement and soggy soils turn rain into runaway water
The team then asked how much the modern city layout intensified Ida’s impact. They ran one simulation that treated the land as if it were mostly bare earth and another that included buildings, roads, and levees. In the “natural” case, water concentrated in low spots and along drainage paths, producing more classic river overflow. In the realistic city case, levees held back some river water, but pavement and structures blocked drainage, spreading shallow, stagnant water across many more blocks. Overall, the city-based run produced about 30% more inundated area and a noticeable boost in peak downstream flow. Another key piece was soil wetness: storms in the days before Ida had already saturated the ground. By the time Ida hit, more than 90% of the new rainfall turned directly into runoff, dramatically amplifying the flood.
Who pays the price when the water rises
Floods are not just about physics; they are about people. Using a Socioeconomic Vulnerability Index built from census data—covering housing costs, education, language, race, age, jobs, and poverty—the authors found that both the most privileged and the most disadvantaged groups faced high exposure. Wealthier riverfront and downtown areas, packed with offices and infrastructure, were hard hit, leading to large economic losses when transport, utilities, and businesses shut down. At the same time, lower-income communities with more pavement and subtle land sinking also saw high exposure and may have fewer resources to prepare and recover. Disaster loan data showed that losses per ZIP code in Philadelphia were far higher than in the rest of Pennsylvania, yet federal loans did not scale with the damage, leaving a lasting “welfare loss” even after aid.
The hidden tipping point in big-city floods
By analyzing nearly a century of river records and running a suite of “what if” simulations, the researchers discovered a tipping point in the Schuylkill’s behavior. Up to roughly the size of today’s official “100-year flood,” high water is mostly contained by engineered banks and embankments. Beyond that threshold, each additional increase in river flow causes the flooded area to grow at a much faster, almost runaway pace. When extreme river peaks line up with very high tides, or with the higher baseline water levels expected from sea-level rise later this century, the flooded area expands even more—by several percent for common extremes and by tens of percent for rarer ones. In the most intense scenarios, an extra 100,000 square meters of city land—enough for several blocks—can end up underwater.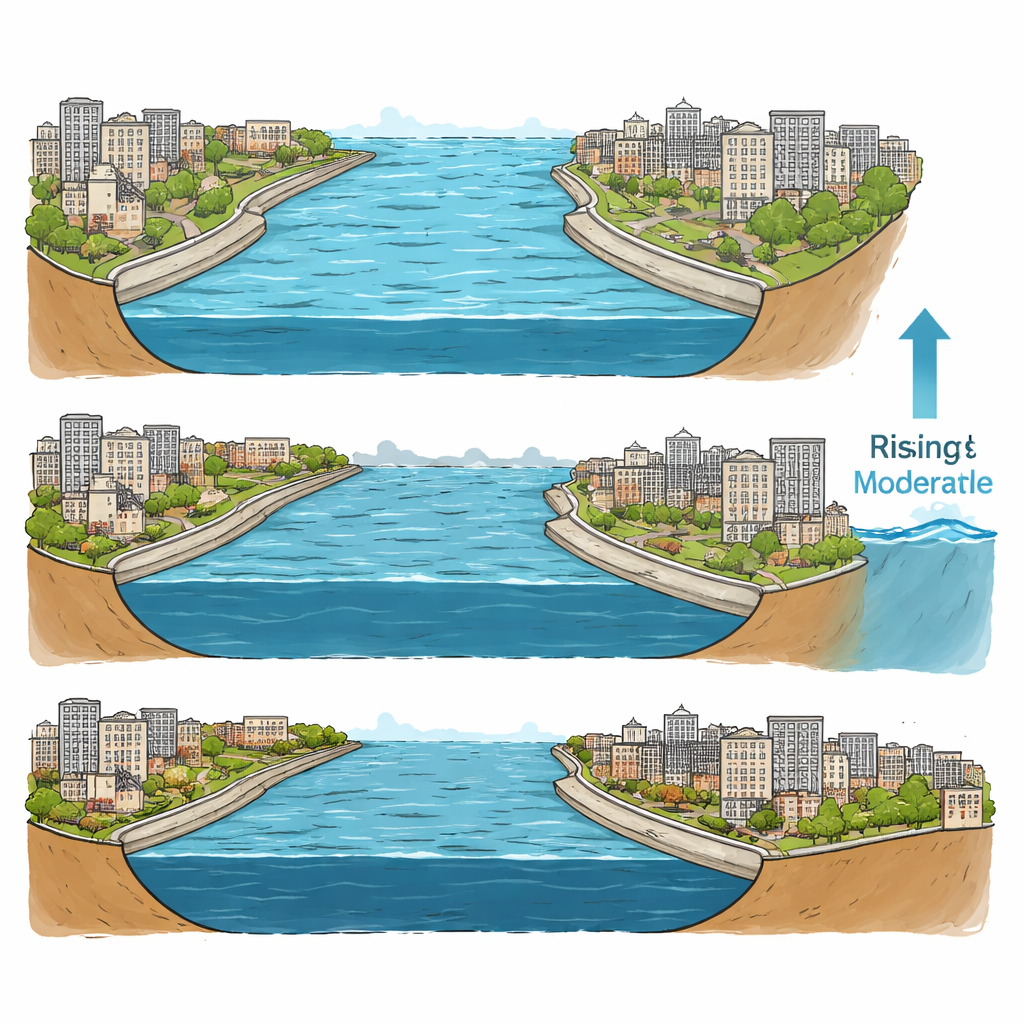
What this means for the future of river cities
This work shows that big-city floods are shaped by a web of factors: not just how hard it rains, but how wet the soil already is, how much pavement covers the ground, how levees and buildings steer water, and how tides and sea level push from downstream. As heavy rainfall events grow more common and seas continue to rise, the Schuylkill’s flood tipping point will be crossed more often, and similar patterns will play out in other coastal river cities. The authors argue that protecting people will require combining green spaces that soak up water, smarter stormwater and river defenses designed for a warming climate, real-time flood forecasts, and policies that focus help where social vulnerability and flood hazard overlap. In short, cities must plan for a future where “once in a century” river floods are no longer rare.
Citation: Xuan, D., Hsieh, M.A., Pongeluppe, L.S. et al. Climate extremes and urbanization drive flood tipping points at the city–river interface. npj Nat. Hazards 3, 20 (2026). https://doi.org/10.1038/s44304-026-00186-8
Keywords: urban flooding, climate extremes, sea-level rise, river tides, Philadelphia