Clear Sky Science · en
Disparities in blood cancer survival in the UK 2009–2019: national cohort studies
Why this study matters to patients and families
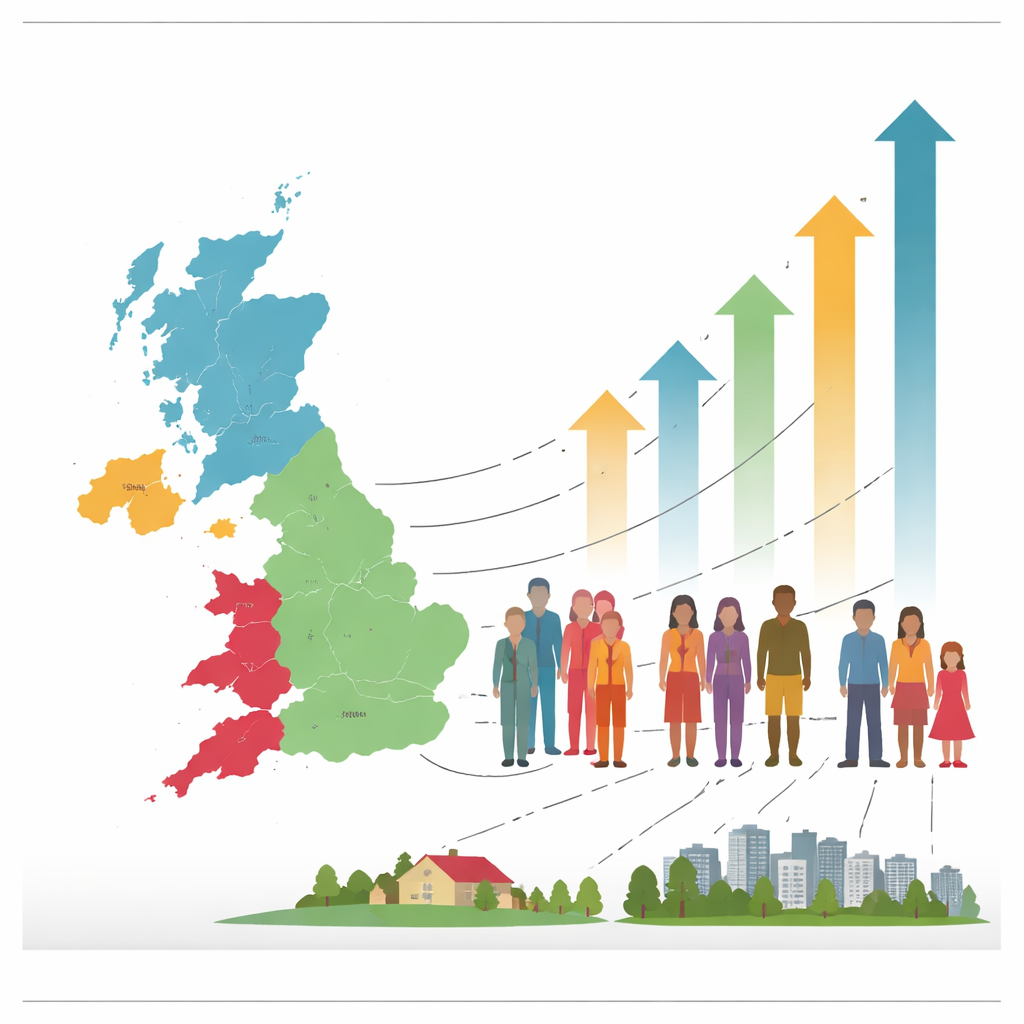
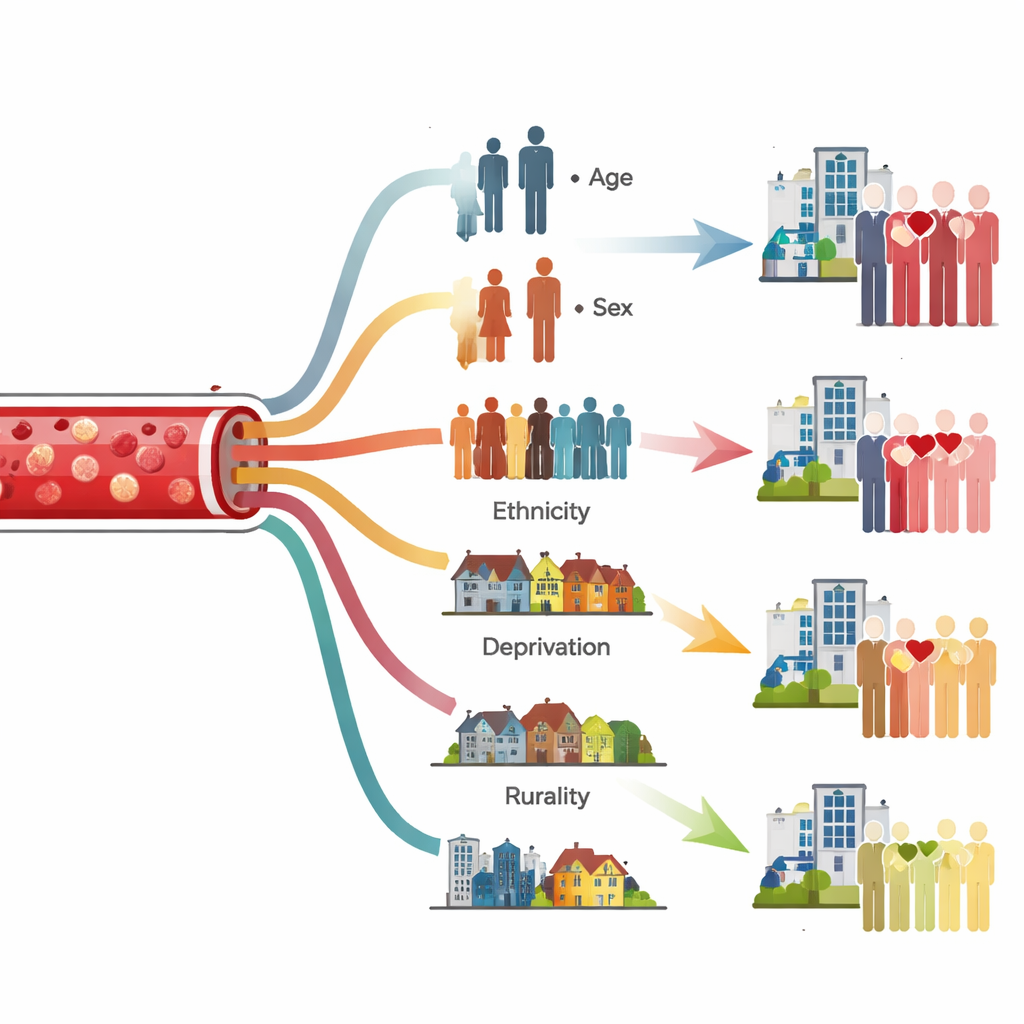
Blood cancers such as leukaemias, lymphomas and myeloma strike more than 40,000 people a year in the UK and remain a leading cause of cancer-related deaths. Yet not everyone has the same chance of surviving them. This study looked across all four UK nations, over a decade, to uncover how survival differs depending on the exact type of blood cancer a person has and who they are—by age, sex, ethnic background, level of deprivation, and whether they live in town or country. Its findings help explain which groups are being left behind and where health services and research might close the gap.
Taking a nationwide look at blood cancers
The researchers pulled together records from national cancer registries in England, Scotland, Wales and Northern Ireland for everyone aged 15–99 diagnosed with a blood cancer between 2009 and 2019. In total they studied over 413,000 diagnoses, classifying each case into one of 25 detailed disease groupings using a system called HAEMACARE. They then estimated how many people were alive 1, 5 and 10 years after diagnosis, taking into account the usual risk of dying in the general population. Rather than pooling the UK into a single number, they analysed each nation separately and then compared patterns across demographic groups.
Overall chances of survival and changes over time
Across the UK, short-term survival from blood cancers was relatively high, with around 8 in 10 people alive one year after diagnosis. Longer-term outlooks varied more: about 6 in 10 survived to five years, and around half reached ten years in the nations where this could be reliably measured. Some blood cancers had excellent outcomes—certain forms of Hodgkin lymphoma had five‑year survival above 90%—while others fared poorly. Acute myeloid leukaemia, an aggressive blood cancer, had the lowest five‑year survival at roughly 1 in 5 patients across all four nations. Encouragingly, survival improved between 2009–2014 and 2015–2019 for most blood cancers. Gains were particularly marked for myeloma (plasma cell neoplasms) and non‑Hodgkin lymphoma, reflecting newer drugs and better diagnosis. However, Scotland did not see a statistically clear improvement for blood cancers overall.
Who does better, and who is left behind?
The study revealed strong and consistent survival gaps between demographic groups. Age made the biggest difference: younger adults did far better than older adults for most blood cancers. For some diseases, such as acute leukaemias and Hodgkin lymphoma, the gap in five‑year survival between people aged 15–44 and those aged 65–74 was more than 40–50 percentage points. Sex also mattered. Women generally had higher survival than men, with differences of 3% or more in many subtypes, especially among myeloid cancers and mantle cell lymphoma. Deprivation showed a clear pattern: in every nation, people living in the least deprived areas had substantially better five‑year survival than those in the most deprived areas, especially for common lymphoid cancers like diffuse large B‑cell lymphoma and chronic lymphocytic leukaemia.
Place, ethnicity and the limits of current data
Where people lived and their ethnic background were also linked to outcomes, though the picture was more complex. In Wales, people in rural areas had better survival than those in urban or mixed areas for several major blood cancer groups, including both lymphoid and myeloid diseases and acute myeloid leukaemia. In contrast, no clear survival differences by rurality were seen in Scotland or Northern Ireland, and England’s data could only be analysed at national level. For ethnicity, detailed analysis was only possible in England. Surprisingly, white patients often had slightly worse survival than non‑white groups in several myeloid cancers and myeloma. Asian and Black patients sometimes did better than white patients for these diseases. The authors stress that these findings are exploratory: ethnicity data are incomplete, and the survival methods do not fully account for differences in background health risks between groups.
What this means for care and policy
Overall, the study shows that blood cancer survival in the UK has improved but remains uneven. The type of blood cancer still plays the largest role in outlook, but age, sex, deprivation, ethnicity and where people live all shape their chances of living longer after diagnosis. Because some blood cancer types may be under‑recorded and key details such as stage at diagnosis, treatment and other illnesses were missing, the authors avoid drawing hard conclusions about causes. Instead, they see these patterns as signposts. They argue that more complete and consistent national data on blood cancers—combined with better information on treatments and patient circumstances—are essential to understand why certain groups fare worse and to design targeted steps to close these survival gaps.
Citation: Hoang, J., Allen, J., Capel, R. et al. Disparities in blood cancer survival in the UK 2009–2019: national cohort studies. BJC Rep 4, 19 (2026). https://doi.org/10.1038/s44276-026-00222-0
Keywords: blood cancer survival, health inequalities, leukaemia and lymphoma, cancer epidemiology UK, socioeconomic deprivation