Clear Sky Science · en
Machine learning survival model for personalised prevention of catheter-related thrombosis in tumour patients
Why this research matters for patients with cancer
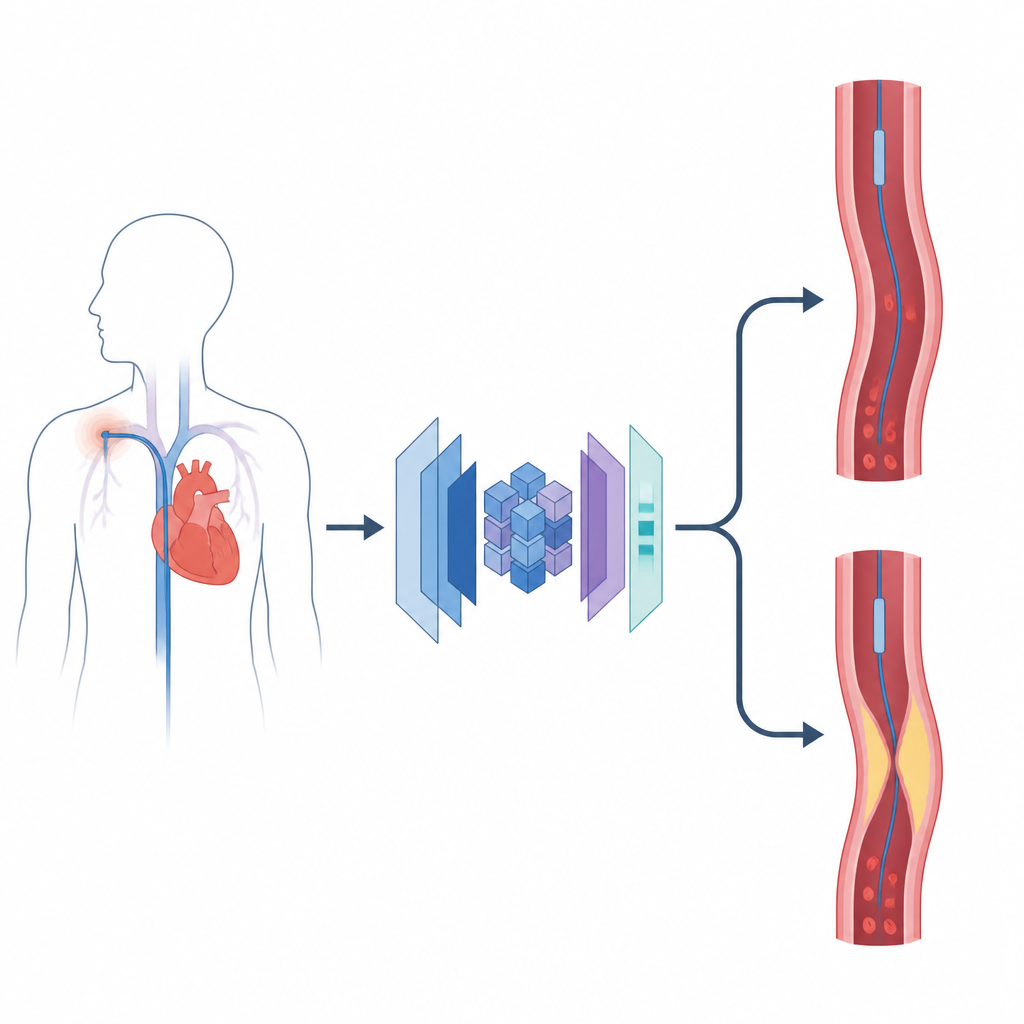
Many people with cancer rely on thin plastic tubes placed in large veins so they can receive chemotherapy and other treatments without repeated needle sticks. These central lines improve comfort but can also trigger dangerous blood clots around the catheter. Doctors currently have few reliable tools to judge which patients are most at risk or when it is safest to remove the catheter. This study introduces a data driven model that aims to predict both who is likely to develop a catheter related clot and when that risk is highest, so care can be better tailored to each person.
A large pool of real world patient information
To build their prediction tool, the researchers gathered catheter data from 30,947 adults with cancer treated at four hospitals in China. All had a confirmed malignant tumor and at least one ultrasound check after a central line was inserted. For each catheter placement, the team collected 47 baseline features including age, sex, body mass index, smoking and drinking habits, past conditions such as high blood pressure or prior clots, tumor type and stage, details about the catheter itself, and common blood test values. They also recorded which cancer drugs and targeted therapies patients received while the catheter was in place, and exactly how long each catheter remained before removal or a clot occurred.
Teaching a model to follow risk over time
Instead of asking a simple yes or no question about whether a clot would ever happen, the team used a survival modeling approach that includes the time from catheter insertion to clot formation or catheter removal. Several machine learning survival models were trained and compared. The final model, called SM CRT, uses an advanced boosting method to produce two kinds of output for each patient: a single risk score that ranks people from lower to higher overall risk, and a full curve that shows how the person’s clot risk rises and falls day by day while the catheter is in place. The model was tuned and tested using strict cross validation and then evaluated on three independent test groups, including one that followed patients over time, to reduce the chance that results were due to overfitting.
Who is at higher risk and when risk peaks
The SM CRT model showed good ability to separate patients who would develop catheter related clots from those who would not, with concordance values around 0.7 in all test cohorts. The analysis surfaced several clear risk patterns. Certain catheter types, especially femorally inserted lines, were linked to higher clot risk, while implanted ports and some arm based lines were more protective when well positioned. Tumor location also mattered: cancers in the chest region, such as those near the superior vena cava where many catheters sit, carried greater risk than tumors in the abdomen or pelvis, likely because of local pressure and clotting factors released near the catheter tip. Among treatments, specific chemotherapy classes, particularly alkylating agents like platinum drugs, and antiangiogenic drugs stood out as high risk, while tumor stage and many routine blood markers were less informative.
Turning predictions into timing decisions
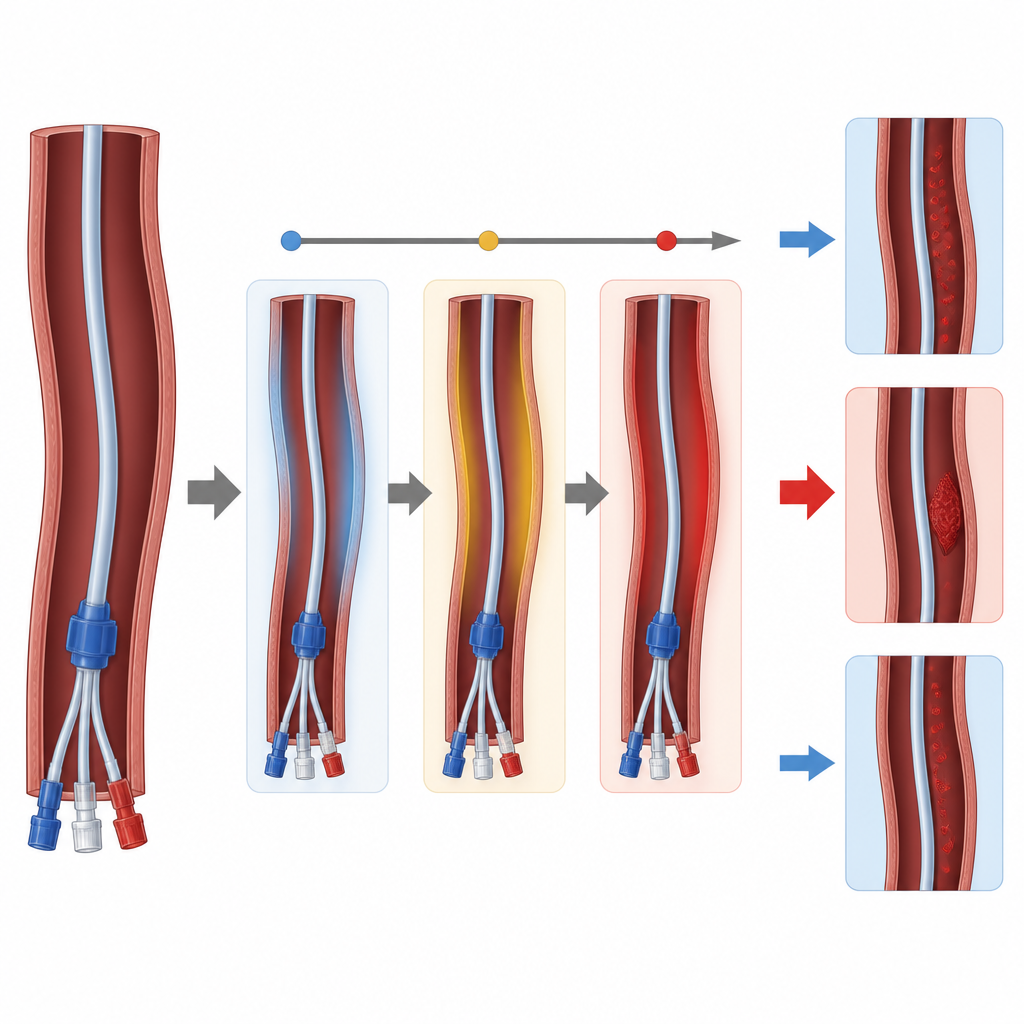
A key innovation of this work is the use of the full risk over time curve rather than only a single score. For each patient, the model estimates a probability curve showing the chance of a clot on each day after insertion. The researchers smoothed these curves and defined a personal high risk window as the days when the predicted risk exceeded half of the individual peak value. Days before this window were labeled low risk and days after it long term. When they compared real world outcomes, catheters removed during the model defined low risk or long term periods had far fewer clot events per catheter day than those removed during the predicted high risk period, even after accounting for differences between patients. Combining the overall risk score with the timing windows allowed a fine grained grouping that helps distinguish patients who are consistently high risk from those whose danger is limited to a short time span.
What this could mean for everyday care
For a lay reader, the main message is that the authors have built a tool that not only estimates how likely a catheter related clot is for a given cancer patient, but also highlights when that risk is most intense. In the future, if such a model is validated in interventional trials and integrated into clinic workflows, doctors might use it to choose the safest catheter type, schedule focused ultrasound checks during predicted high risk days, adjust blood thinning medicines, or plan earlier catheter removal when risk spikes. While further testing is needed before it can guide routine practice, this study shows that survival based machine learning can translate large hospital data sets into practical, time aware insights that may help reduce complications for people undergoing cancer treatment.
Citation: Ge, H., Liu, Q., Xie, J. et al. Machine learning survival model for personalised prevention of catheter-related thrombosis in tumour patients. Commun Med 6, 304 (2026). https://doi.org/10.1038/s43856-026-01561-2
Keywords: catheter thrombosis, cancer patients, machine learning, risk prediction, central venous catheter