Clear Sky Science · en
Personalized mapping of body homeostasis using whole-body PET connectomics and routine FDG PET imaging
Why whole-body scans can tell a bigger story
Many medical scans are used like spotlights that search for obvious trouble spots such as tumors. This study asks a different question: can a routine whole-body PET scan also reveal how all of our organs work together as a system, and how that system is disturbed in chronic disease? The authors develop a way to turn a single scan into a personal map of organ-to-organ relationships, offering a new view of body balance and breakdown.
From bright spots to body-wide patterns
Positron emission tomography, or PET, shows where a small dose of a radioactive sugar is taken up in the body, highlighting how active different tissues are. Traditionally, doctors focus on a few hot or cold spots: a tumor, an inflamed artery, a suspicious lymph node. Yet chronic illnesses often reshape the entire network of organs that keep the body in balance. Instead of looking only at isolated regions, the researchers treat the body as a connected system and ask how organs jointly handle the tracer in everyday clinical scans.
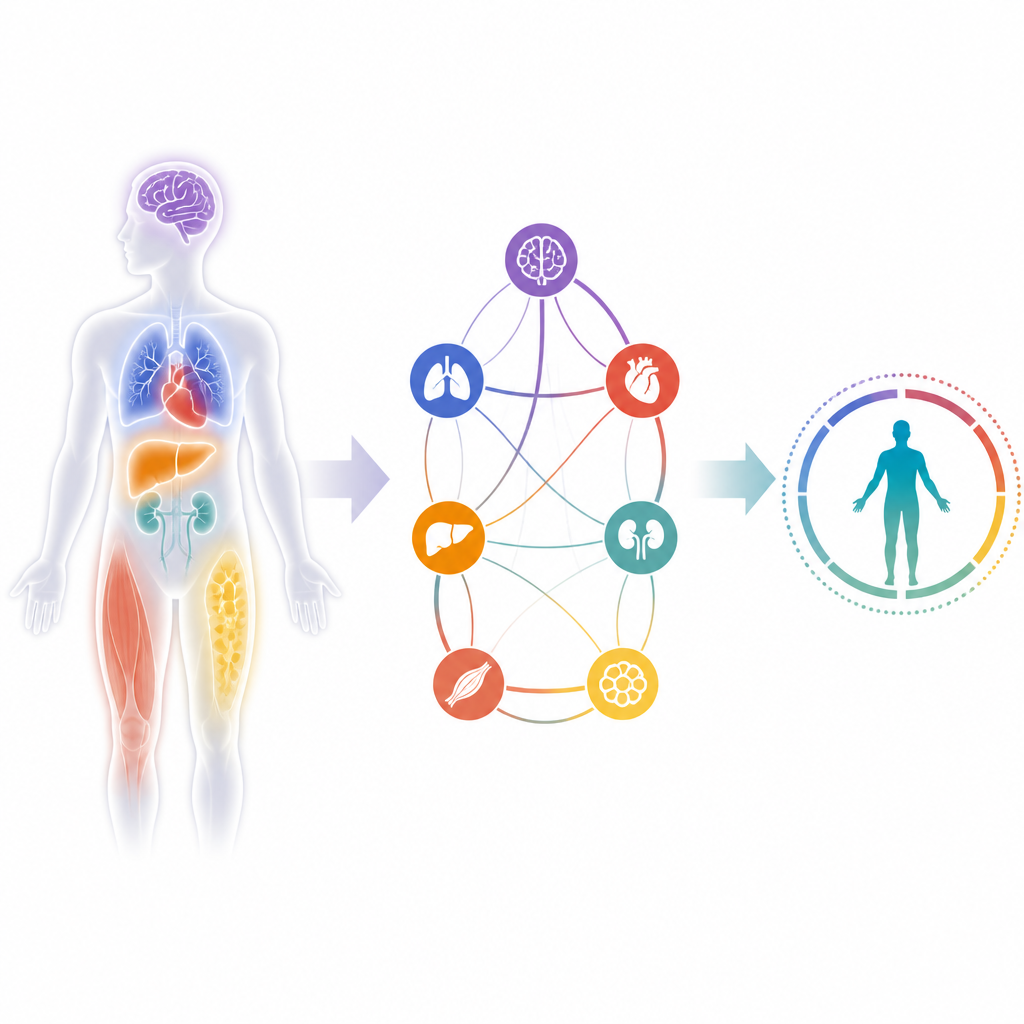
Turning a scan into a network map
To build this system-wide view, the team analyzed routine PET-CT scans using a standard sugar tracer. With an automated tool, they divided each scan into 13 major organ and tissue groups, including brain, heart, lungs, liver, kidneys, fat, bones, and muscles. Rather than summarizing each organ with a single average value, they kept the full pattern of uptake inside it, capturing both typical activity and subtle variations. They then measured how similar or different these patterns were between every pair of organs and combined this information into a network, or “connectome,” for each individual patient. In this network, organs are nodes and the strength of their metabolic relationship appears as links.
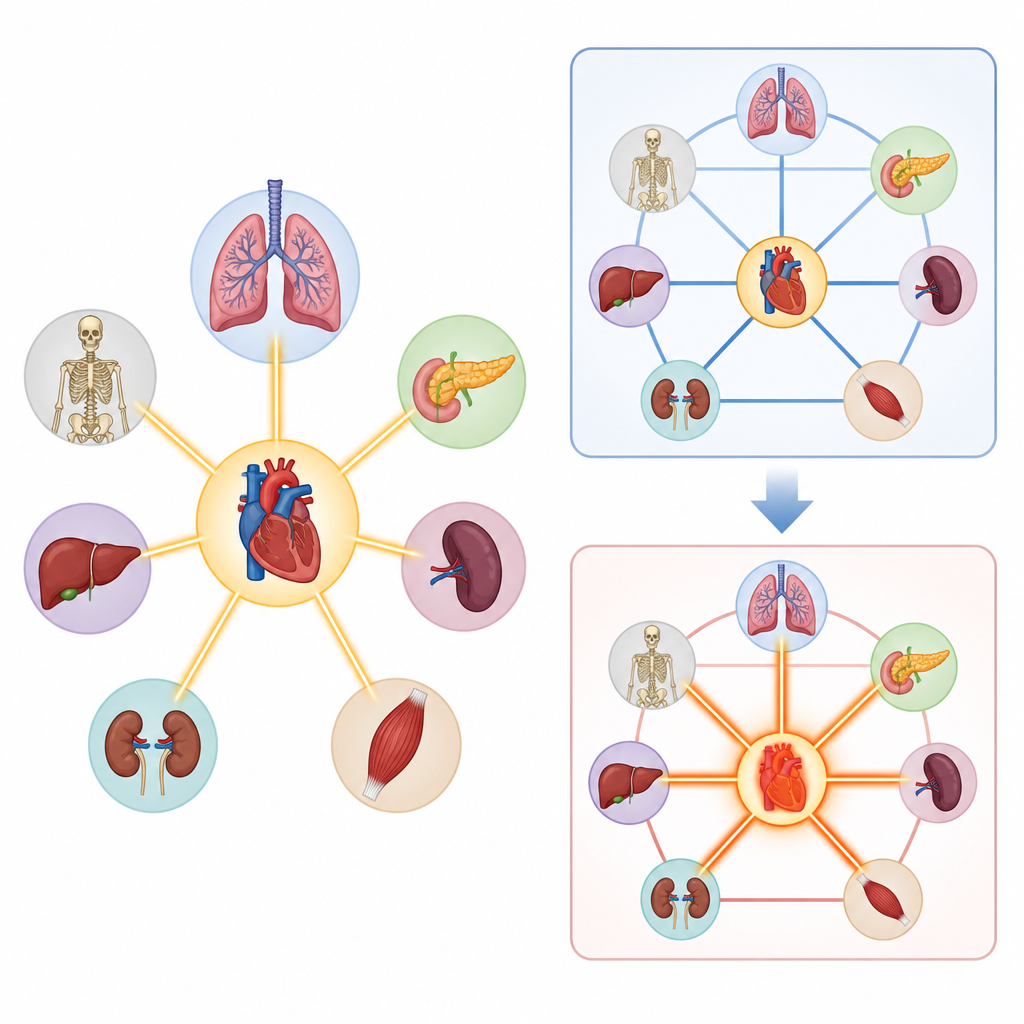
Testing the method in a serious heart–lung disease
The scientists applied their framework to people with advanced pulmonary arterial hypertension, a rare condition where blood vessels to the lungs become narrowed and stiff. This puts heavy strain on the right side of the heart and triggers wide-ranging changes across the body. They compared 22 affected patients to 46 people whose scans looked normal and who had no signs of major illness at the time. A machine learning model trained only on these organ networks, without being told which organs mattered most, could distinguish patients from controls about three quarters of the time. The most influential links involved the right side of the heart and its connections to bones, the rest of the heart, the pancreas, liver, spleen, kidneys, lungs, and muscles, echoing what is already known about this disease from decades of clinical research.
Checking how stable the maps really are
Because PET images are somewhat blurry at organ borders, the team checked whether small errors in outlining organs might create misleading patterns. They deliberately scrambled the boundaries between neighboring tissues and rebuilt the organ networks under moderate and severe distortion. The overall network shape and, crucially, the strong right-heart signal remained largely unchanged, and simple statistical models still separated patients from healthy people with similar accuracy. This suggests that the method is capturing genuine physiological differences rather than fragile artifacts of image processing.
What this could mean for future care
By extracting personal “connection maps” from a single routine PET scan, this work points toward a new way of reading medical images. Instead of asking only where disease is located, clinicians could also ask how illness disrupts the coordination of organs across the body. For conditions like pulmonary arterial hypertension, the altered network around the right heart becomes a fingerprint of disturbed body regulation. With further validation in larger and more diverse groups, similar maps could help track how chronic diseases spread their influence through the body and might one day guide more tailored monitoring and treatment strategies.
Citation: Labarthe, A., Varet, S., Savale, L. et al. Personalized mapping of body homeostasis using whole-body PET connectomics and routine FDG PET imaging. Commun Med 6, 294 (2026). https://doi.org/10.1038/s43856-026-01549-y
Keywords: PET imaging, organ networks, pulmonary arterial hypertension, metabolic homeostasis, precision medicine