Clear Sky Science · en
Use of continuous glucose monitoring to stratify individuals without diabetes
Why tracking blood sugar all day matters
Many people who feel healthy today may already have subtle problems in how their bodies handle sugar, long before diabetes is diagnosed. This study asks a simple but powerful question: if we strap small sensors on thousands of adults and watch their blood sugar rise and fall around the clock, can we boil all that complex information down to just a few easy-to-understand numbers that flag early risk to the heart and liver?
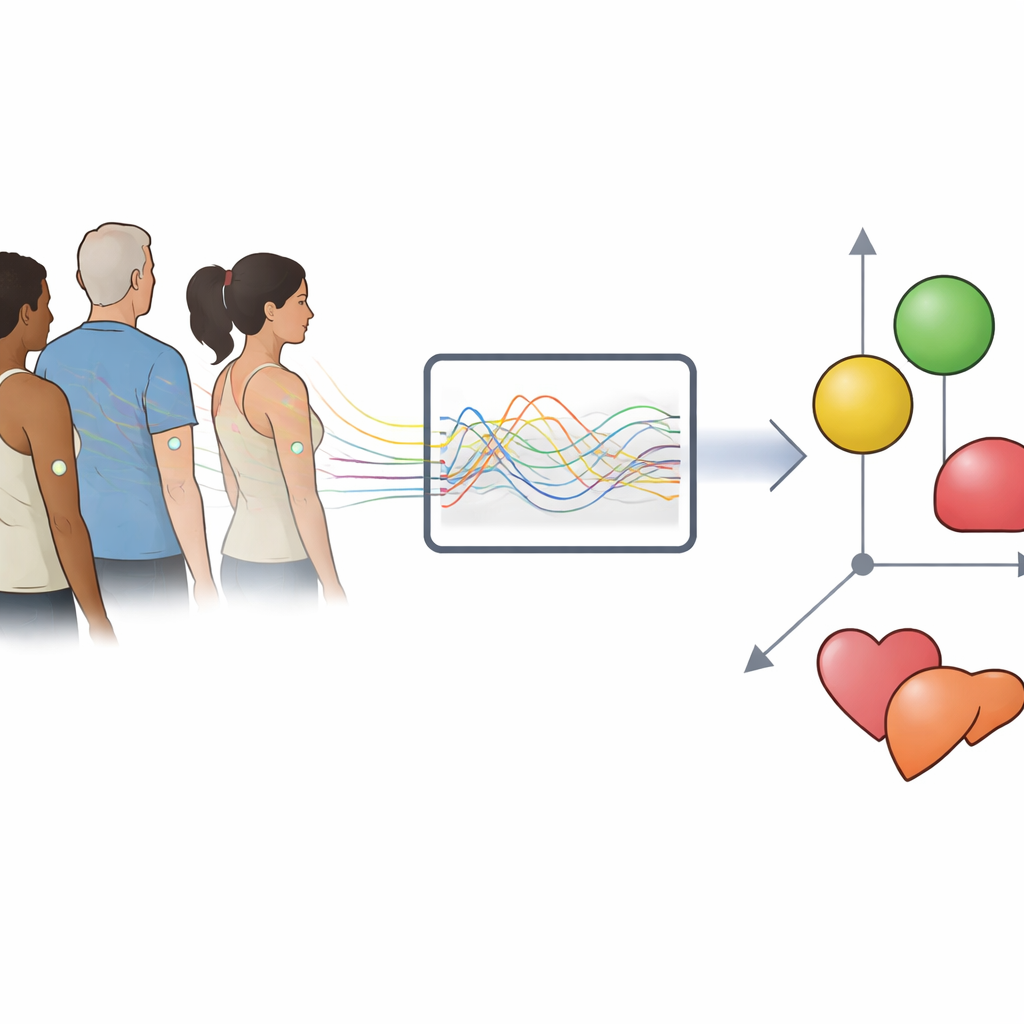
Turning streams of sensor data into three simple numbers
Researchers analysed continuous glucose monitoring (CGM) data from more than 8,000 adults who did not carry a diabetes diagnosis. These wearable sensors record sugar levels every few minutes over many days, generating dozens of possible metrics: how often levels are high or low, how jagged the curve is, how long spikes last, and more. Using statistical tools that look for hidden structure in large datasets, the team asked which combinations of measures best captured how people differ from one another. They found that more than 80 percent of the differences between individuals could be explained by just three ideas: the average level of sugar over time ("mean"), how much it swings up and down ("variance"), and how similar one reading is to recent readings ("autocorrelation," a measure of how long sugar levels tend to stay on a given path).
Testing the three-number code after meals
To see whether these three features truly describe how blood sugar behaves in real life, the scientists turned to detailed meal studies. In one project involving 863 participants, everyone ate carefully controlled test meals while their sugar levels were tracked for four hours afterward. The team used a type of neural network called an autoencoder to compress each person’s post-meal sugar curve into a small set of abstract coordinates and then rebuild the original curve. A three-dimensional version of this model captured the shapes of the curves far better than a simpler, two-dimensional one, while adding extra dimensions brought little improvement. Crucially, the three concrete measures—average level, amount of fluctuation, and pattern persistence—could predict these abstract coordinates very well, meaning that the three-number summary carries nearly all of the useful information in the full sugar trace.
Checking that the pattern holds in other settings
The researchers then challenged their framework with very different kinds of data. They tested it on a classic sugar drink test, where volunteers drink a fixed amount of glucose and have blood drawn repeatedly, and on additional CGM recordings from everyday life, where meals are irregular and often closely spaced. In both cases, three dimensions again proved to be the sweet spot: good enough to reconstruct people’s sugar curves with high accuracy, but simple enough to remain understandable. Traditional markers used in clinics, such as fasting sugar and the two-hour value after a sugar drink, mostly captured only the "average" dimension and missed much of the variation seen in how people’s levels rise and fall.
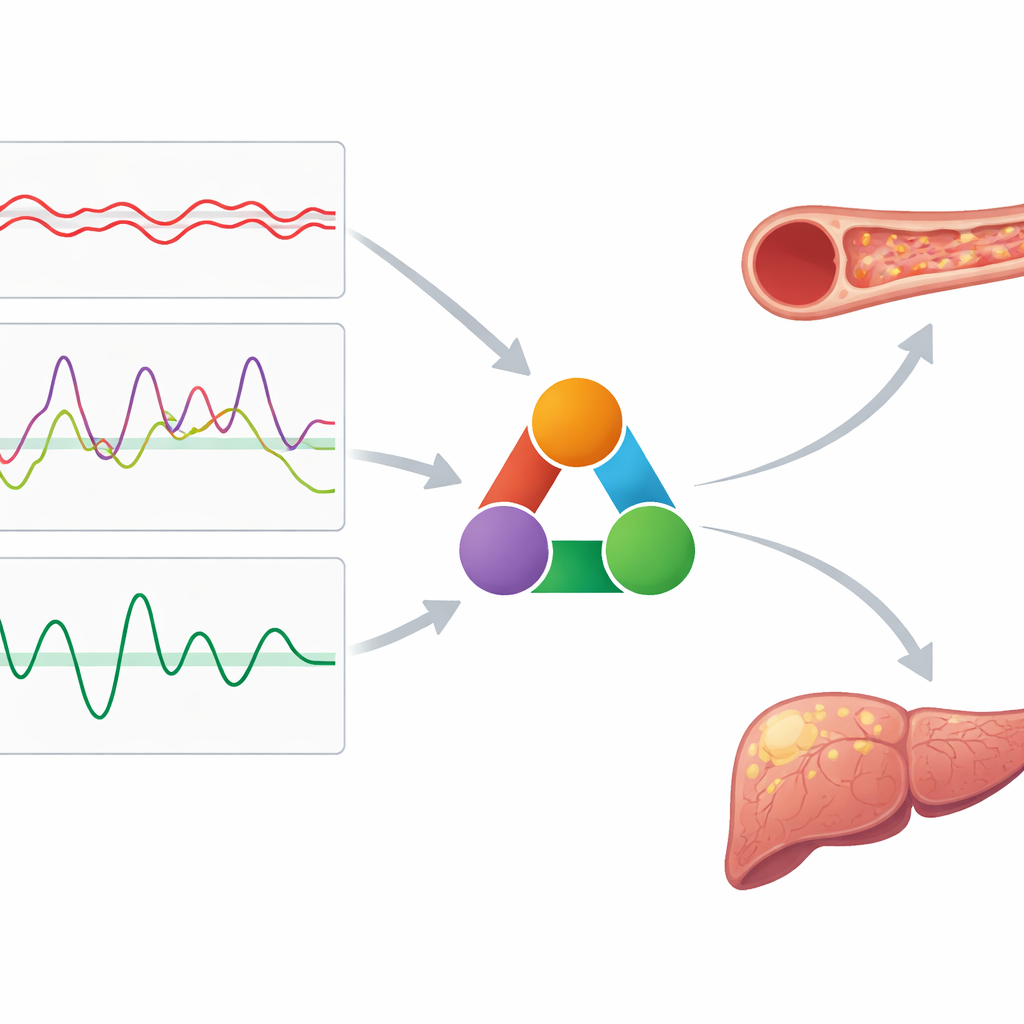
Linking sugar patterns to heart and liver health
Beyond describing sugar curves, the team wanted to know whether these three features relate to early signs of damage in key organs. In a subgroup of nearly 1,800 participants, ultrasound scans measured the thickness of the neck artery wall—a marker of artery clogging—and several properties of the liver linked to fat content, stiffness, and inflammation. All three CGM features showed meaningful, independent ties to these organ measures, even after accounting for blood pressure and cholesterol. For instance, people whose sugar readings were more strongly “sticky” over time, as captured by the autocorrelation measure, tended to have thicker artery walls and changes in liver tissue, despite not having diagnosed diabetes. By grouping participants into clusters based on the three numbers, the researchers could also define reference ranges and see that those whose values exceeded certain thresholds tended to have poorer insulin sensitivity in separate, highly controlled tests.
What this means for catching risk early
This work suggests that the tangled, high‑frequency wiggles of blood sugar captured by modern sensors can be reduced to three clear, physiologically meaningful dimensions without losing much information. Together, these numbers describe how high sugar levels sit on average, how wildly they swing, and how slowly they change direction. Because each of these dimensions is linked to early changes in the heart’s blood vessels and the liver, they may help doctors and researchers spot people at higher risk long before standard tests do. While more work is needed to show that acting on these measures can prevent disease, this three-number code offers a promising and interpretable way to translate round‑the‑clock sensor data into simple insights about metabolic health.
Citation: Sugimoto, H., Sapir, G., Keshet, A. et al. Use of continuous glucose monitoring to stratify individuals without diabetes. Commun Med 6, 260 (2026). https://doi.org/10.1038/s43856-026-01523-8
Keywords: continuous glucose monitoring, prediabetes risk, blood sugar patterns, metabolic health, heart and liver damage