Clear Sky Science · en
Risk mapping novel respiratory pathogens with large-scale dynamic contact networks
Why this matters to everyday life
After COVID-19, many people wondered why some places became outbreak hot spots while others stayed relatively untouched, and which measures actually made a dent in the spread. This study tackles those questions head-on by building a highly detailed computer model of how a new respiratory virus could sweep through the Netherlands, taking into account where people live, how they move, and whom they meet at home, school, work, and elsewhere. Its lessons about urban hubs, travel, and staying home when sick are broadly relevant to how societies might prepare for future pandemics.
Following people through their day
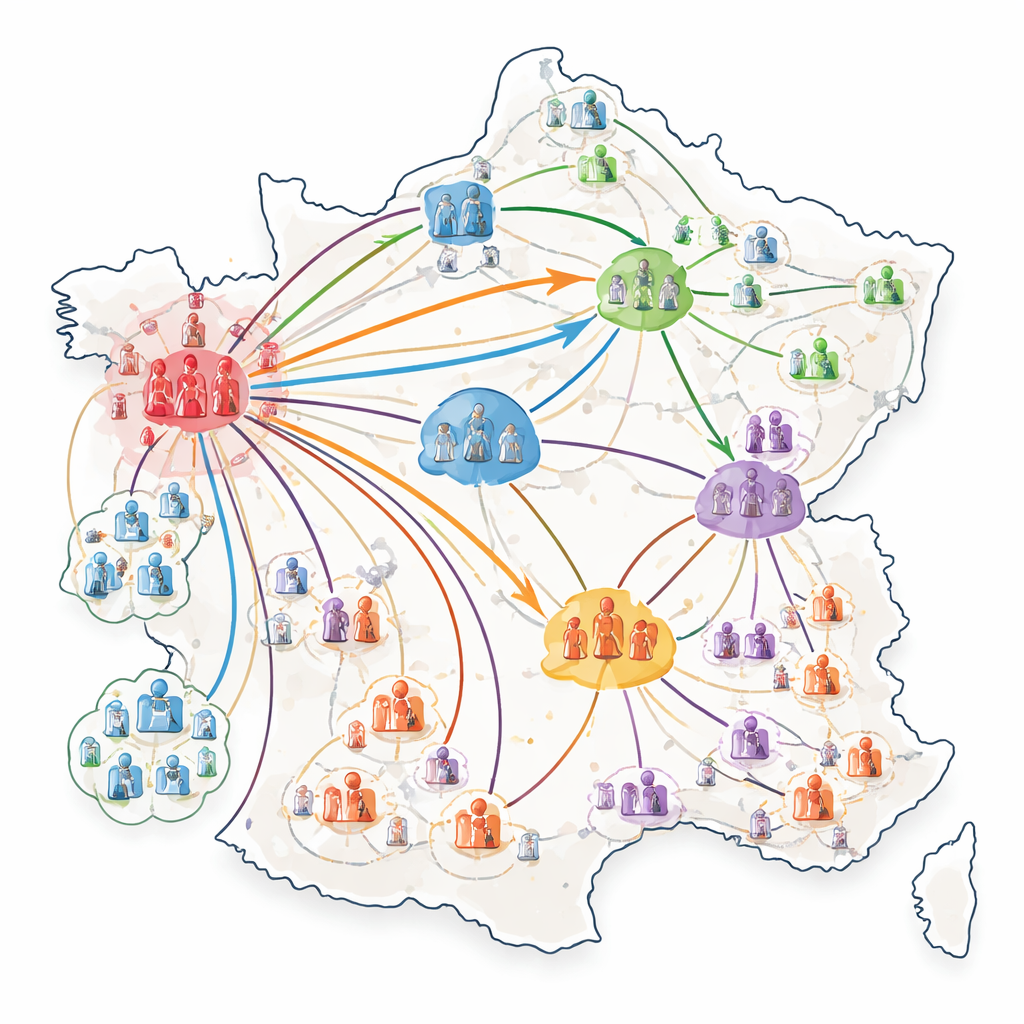
Instead of treating the population as a uniform soup where everyone mixes equally, the researchers represent hundreds of thousands of "actors," each standing in for 100 real people. Every actor has an age group and role—such as pre-school child, student, working adult, or retiree—and is assigned to a specific municipality based on real Dutch statistics. Using data on commuting and travel, the model gives each actor a weekly schedule, broken down by the hour, that determines when they are at home, at school, at work, or visiting other places. As these actors move, the model uses contact patterns from social surveys to decide whom they are likely to meet in each setting and hour. From this constant ebb and flow emerges a dynamic web of human contacts, far more lifelike than traditional models that assume simple, well-mixed groups.
Watching a new virus take hold
On top of this moving web of encounters, the team simulates a new respiratory virus with characteristics similar to flu or SARS-CoV-2: a short delay between infection and being contagious, around a week of infectiousness, and a basic reproduction number high enough to cause fast growth. They "seed" the virus by infecting just five people of a specific age group in a chosen municipality and then follow what happens over the first 17 days. Because each person’s contacts and movements are different, the model naturally captures random chance: sometimes the outbreak fizzles, and other times it takes off. By repeating this process many times for each municipality and age group, the researchers build detailed risk maps that show where an introduction is most likely to lead to widespread transmission.
Big cities as epidemic engines
The simulations reveal that where the first cases appear matters a great deal, especially in the early weeks. When the virus starts in a remote, sparsely populated area, the number of infections grows slowly and spreads geographically at a modest pace. But when the same number of initial cases appears in or near the densely populated western core of the Netherlands, infections mount much more quickly and spread across the country. Large cities such as Amsterdam, Rotterdam, The Hague, and Utrecht act as powerful engines of transmission, generating more infections than their population share would suggest. These cities have many residents, attract commuters and visitors, and serve as crossroads in the national travel network, making them efficient amplifiers of a new pathogen.
Testing staying home and travel barriers
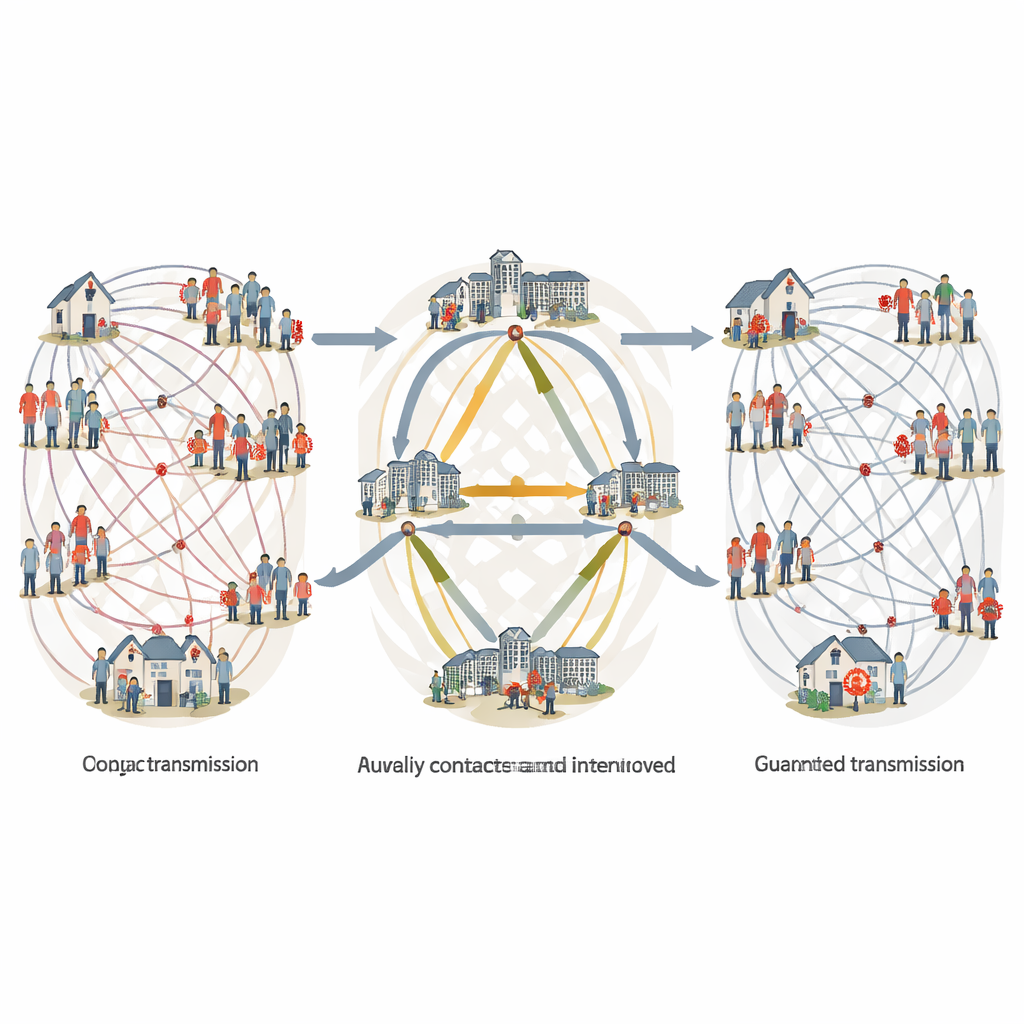
The model also lets the authors test how behavior and policy might change the course of an early epidemic. They examine two simple strategies that start from day one: people with symptoms choosing to self-isolate, and restrictions on travel into and out of the large urban core. Because roughly half of infectiousness in their scenario comes after symptoms begin, perfect self-isolation could in theory cut transmission almost in half. In practice, even when half of symptomatic people stay home, the total reduction in infections after 17 days is modest, and only reaches about one-third when everyone with symptoms isolates. Travel restrictions, in contrast, have a stronger effect at every level of compliance. When nearly all people respect closed borders around big cities, the number of new infections after 17 days can drop by more than two-thirds, largely because the main urban hubs are effectively cut off from feeding the rest of the country.
What this means for future outbreaks
To a non-specialist, the core message is that early epidemics are not smooth waves washing evenly over a country. They are shaped by the fine details of how real people live, move, and meet—and by the outsized role of major cities. This study shows that models which follow individuals through time and space can produce realistic maps of where a new respiratory virus is most likely to spread and how fast. Such tools could help health authorities focus scarce resources and consider targeted measures, like temporary travel limits around key hubs, rather than only nationwide rules. While the work is specific to the Netherlands and makes simplifying assumptions, it illustrates a broader point: understanding and acting on the geography of human contact may be just as important as understanding the virus itself.
Citation: Romeijnders, M., van Boven, M. & Panja, D. Risk mapping novel respiratory pathogens with large-scale dynamic contact networks. Commun Med 6, 229 (2026). https://doi.org/10.1038/s43856-026-01446-4
Keywords: epidemic modeling, respiratory viruses, human mobility, network epidemiology, urban transmission hubs