Clear Sky Science · en
Global estimates of glacier equilibrium-line altitude ratios for enhanced paleoclimate reconstructions
Why Old Glaciers Matter Today
Glaciers are more than dramatic rivers of ice; they are long‑running climate recorders. As they grow and shrink, they carve landforms that preserve clues about temperature and snowfall thousands of years ago. To turn those shapes in the landscape into numbers for past climate, scientists need to know where on each glacier the yearly gain of snow balances the yearly melt—the equilibrium line. This study shows that the shortcuts scientists have long used to estimate that height can be misleading, and offers a new global, glacier‑by‑glacier way to do it better.
Reading the Hidden Line on a Glacier
On every glacier there is a rough dividing line: above it, winter snow tends to survive the summer; below it, more ice melts than accumulates. The height of this invisible boundary, the equilibrium‑line altitude, shifts when climate warms or cools. If past glaciers sat lower in a valley than today’s, their equilibrium lines must also have been lower, implying a colder or snowier climate. Because direct measurements are rare and modern satellite records are short, researchers usually estimate this height from simple ratios that describe how much of a glacier is in its snowy “accumulation” zone versus its melting “ablation” zone, or how high the line sits between the glacier’s top and bottom. Until now, most work has treated those ratios as virtually constant worldwide.
Why One‑Size‑Fits‑All Numbers Fail
The new study reveals that these seemingly handy rules of thumb break down once you look beyond a few well‑studied glaciers. Earlier global values came mostly from a small monitoring network that covers less than a tenth of a percent of the world’s ice masses and is biased toward easily accessible mountain glaciers. Using those average ratios on very different glaciers—such as ice caps that spread over plateaus, glaciers choked with rock debris, or glaciers that end in the ocean—can shift the estimated equilibrium line by tens of meters. That, in turn, can skew reconstructed temperatures by several tenths of a degree Celsius, enough to blur important details of past climate patterns.
Simulating Nearly Every Glacier on Earth
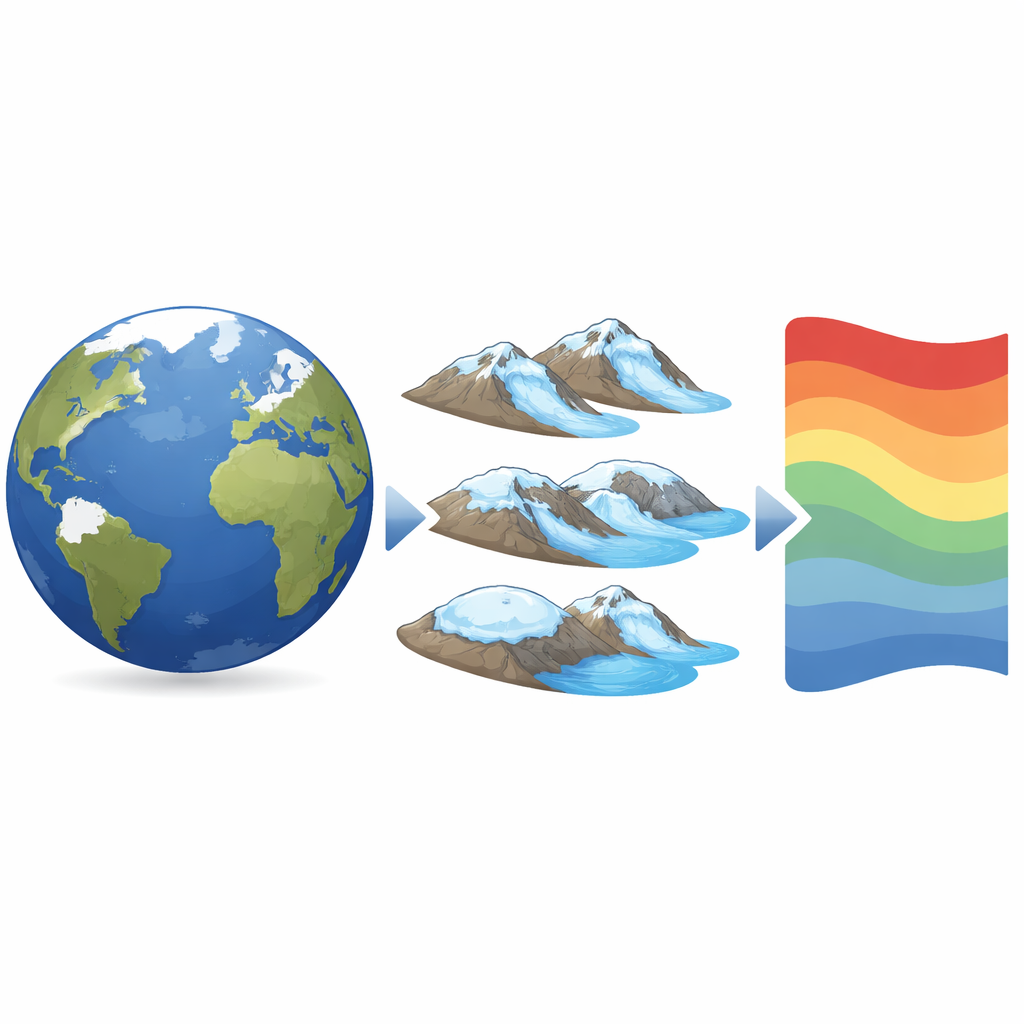
To tackle this problem, the authors combined two state‑of‑the‑art computer models of glacier flow and melt with a global inventory of about 215,000 individual glaciers (excluding the Greenland and Antarctic ice sheets). They tuned the models with satellite‑based estimates of how much ice each glacier has lost in recent decades, then simulated how the balance between snowfall and melting changes with elevation for each glacier. From these simulations they derived three standard ratios for every glacier and checked their results against the limited field data and recent satellite analyses. While individual glaciers showed differences, the overall patterns from the model and observations agreed well, giving confidence that the global picture is realistic.
How Glacier Type and Setting Change the Story
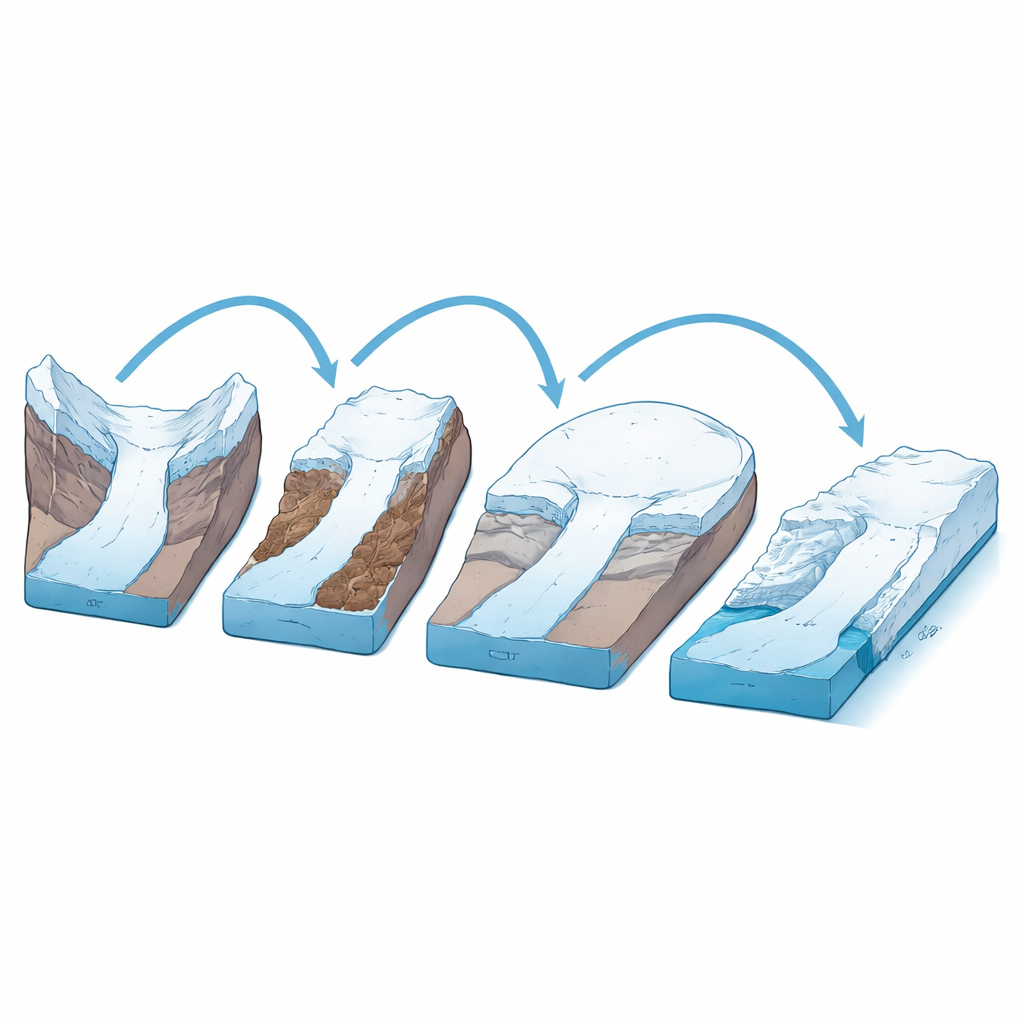
The global maps that emerge show clear regional patterns linked to glacier type and local environment. Polar regions and ice caps tend to have a larger share of area in the snowy zone, reflecting cold, low‑snow climates where glaciers must gather ice over broad high‑elevation surfaces to survive. Glaciers ending in the ocean need especially large snowy areas because they also lose mass by calving icebergs; their ratios look very different from those of land‑terminating glaciers. Debris‑covered glaciers, with blankets of rock on their tongues, show smaller snowy fractions because thick debris can insulate ice and change how it melts. Temperature, snowfall, glacier size, slope, and the direction a glacier faces all nudge the ratios up or down, but the study finds that one measure—the fraction of glacier area above the balance line—is generally more stable than others across this wide diversity.
A Better Toolkit for Reconstructing Past Climate
By providing glacier‑specific ratios for nearly every glacier on the planet, the authors replace coarse global averages with a tailored toolkit. They also package their results into a simple decision‑tree calculator that guides users toward appropriate values based on glacier type and setting. For scientists reading the marks left by vanished glaciers, this means smaller errors when converting old ice limits into estimates of past temperature and snowfall, and clearer insight into how different regions responded to past climate shifts. In plain terms, the study sharpens one of our key instruments for replaying Earth’s climatic past—and, in doing so, helps us better grasp the long‑term context of today’s rapid glacier loss.
Citation: Yang, W., Mackintosh, A.N., Cooper, EL. et al. Global estimates of glacier equilibrium-line altitude ratios for enhanced paleoclimate reconstructions. Commun Earth Environ 7, 391 (2026). https://doi.org/10.1038/s43247-026-03391-5
Keywords: glaciers, paleoclimate, equilibrium line altitude, climate reconstruction, glacier modeling