Clear Sky Science · en
Deep learning-driven community resilience rating based on intertwined socio-technical systems features
Why city strength in tough times matters
Cities around the world are facing more floods, storms, and other shocks, and everyday residents feel the impacts when roads fail, power goes out, or hospitals become hard to reach. This study introduces a new way to understand how well different neighborhoods can withstand and bounce back from such disruptions. Instead of looking at one system at a time, it uses modern machine learning to see how buildings, roads, cell towers, green spaces, and social conditions work together to shape the real-life strength of communities.
Looking at the city as a living web
Traditional scorecards for “resilient cities” usually add up many indicators, each given a weight by experts, to produce a single index. These methods are helpful but treat the pieces of a city—such as roads, hospitals, and income levels—as if they act independently. In reality, trouble often spreads through hidden chains of cause and effect. A flooded intersection can cut off access to clinics, which in turn worsens health impacts. The authors argue that to capture this web of interactions, we need tools that can detect subtle patterns and nonlinear effects across many kinds of data at once.
A smart rating system for neighborhood resilience
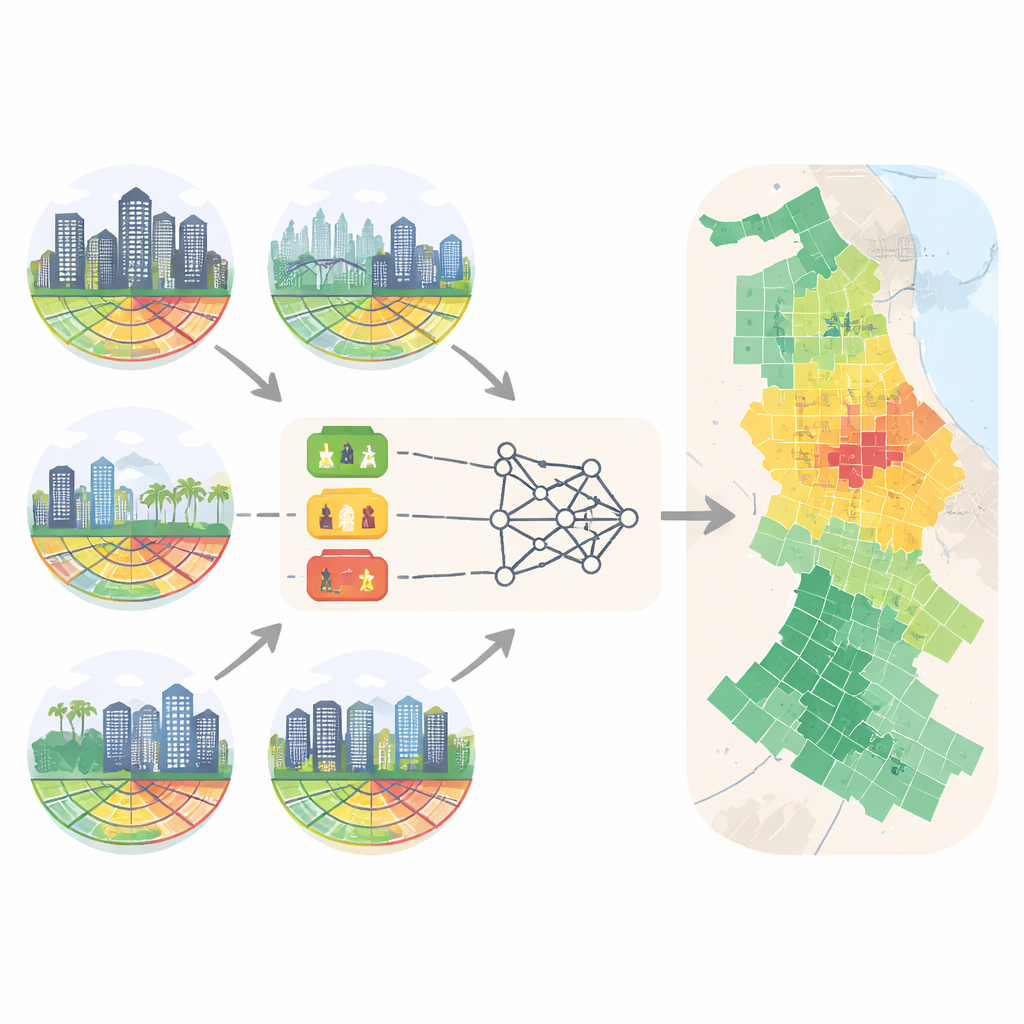
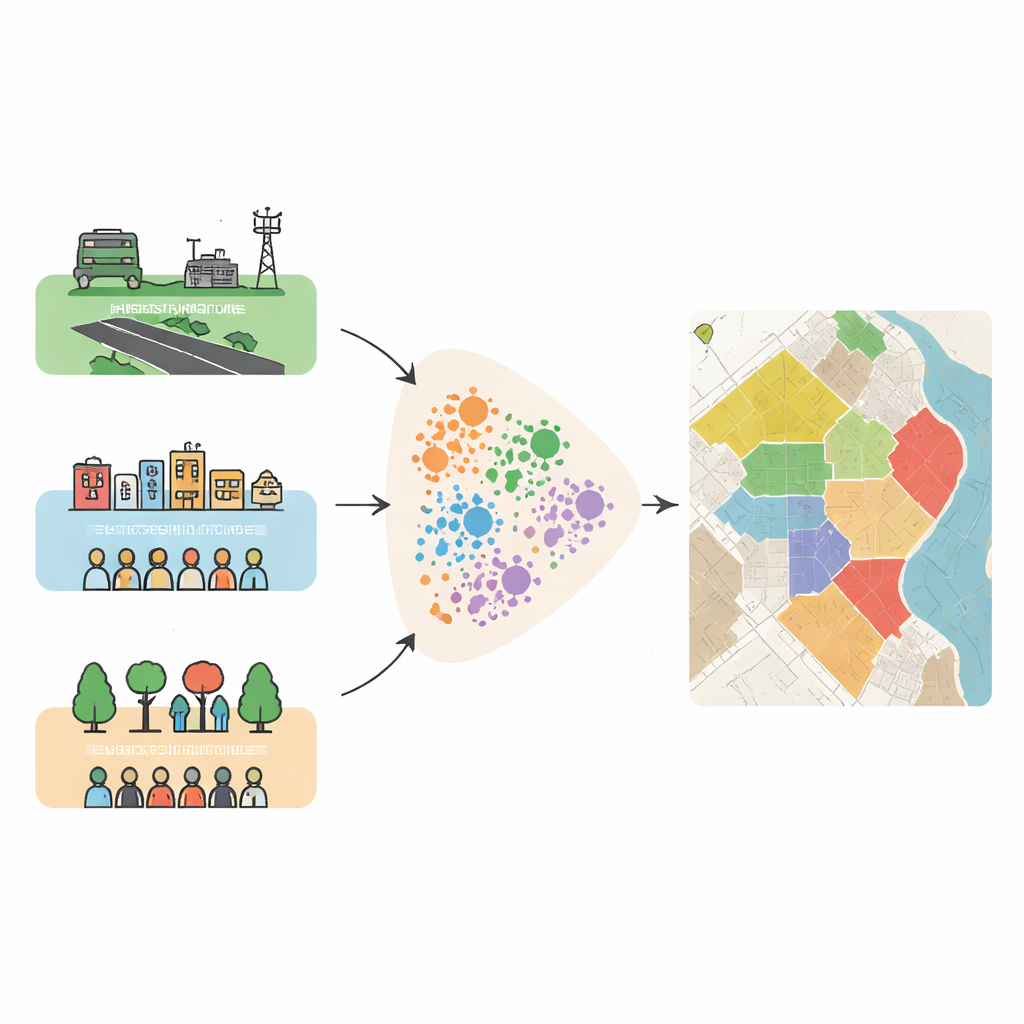
To tackle this challenge, the researchers created Resili-Net, a three-part deep learning framework that rates resilience for small grid cells across a metropolitan area. It ingests twelve measurable features that fall under three plain ideas: how sturdy things are (such as newer buildings and cell towers, or lower poverty), how many backups exist (like multiple roads, hospitals, or cell towers), and how well communities can use resources (including road density, internet speed, green space, and education levels). Using only publicly available data, Resili-Net first learns compressed patterns that describe how these features interact, then groups locations into clusters, and finally converts those clusters into resilience levels that range from very low to very high.
What the model reveals about four major US regions
The team applied Resili-Net to the larger regions around Los Angeles, Chicago, Dallas, and Houston, dividing each into a grid of 2-kilometer squares. The model identified five resilience levels in each region and showed that similar levels tend to clump together rather than scatter randomly. Higher-resilience areas are usually in or near core city zones with newer buildings, more connected roads, faster internet, better access to healthcare, and higher education. In contrast, pockets of low resilience often sit at the edges or are embedded within otherwise stronger surroundings, reflecting older infrastructure, fewer facilities, and higher poverty. When compared with a simple “add and rank” method using the same data, Resili-Net preserved sharp contrasts and exposed fine-grained weak spots that a basic index smoothed over.
Testing what-if futures and layering in flood danger
The researchers also used Resili-Net to explore how targeted upgrades might change resilience. In one scenario, low-resilience locations were given more nearby hospitals and longer road networks, mimicking a focused infrastructure push. Some regions, such as greater Los Angeles, showed clear improvements. Others, such as parts of Chicago, responded unevenly, with some neighborhoods actually slipping because of the complex interplay of social and physical factors. This suggests that simply adding more roads and hospitals is not always the best answer; in some places, investments in social ties or green spaces may matter more. The team then combined resilience maps with a separate deep learning model of flood risk, producing joint maps that highlight communities facing both high hazard and low resilience, often where socially vulnerable residents live.
Turning data into fairer and smarter city choices
For everyday people, the takeaway is that a community’s ability to cope with disasters is not just about how big the storm is—it is about how well many pieces of city life fit together beforehand. Resili-Net offers planners and policymakers a way to see those connections more clearly, flagging places where a mix of weak infrastructure and social hardship could turn a hazard into a crisis. By pointing to which features matter most in each type of neighborhood, the framework can guide more tailored, evidence-based investments—whether that means strengthening roads, expanding clinics, adding green space, or supporting vulnerable residents—so that cities become not only stronger, but also fairer, in the face of growing risks.
Citation: Yin, K., Li, B. & Mostafavi, A. Deep learning-driven community resilience rating based on intertwined socio-technical systems features. npj Urban Sustain 6, 56 (2026). https://doi.org/10.1038/s42949-026-00364-7
Keywords: urban resilience, deep learning, flood risk, socio-technical systems, city planning