Clear Sky Science · en
The R = 1 threshold can misclassify epidemic stability
Why stable infection numbers can still be a warning sign
Public health officials around the world rely on a single headline number, called the reproduction number R, to decide whether an outbreak is growing or under control. Many people have learned that if R is below 1 an epidemic is shrinking, and if it is above 1 it is expanding. This paper shows that this simple rule can be seriously misleading when it is based on averages across many different places or groups. Even when the overall R seems safely at 1, some communities can already be on a path to renewed rapid spread that remains hidden until it is harder and costlier to stop.
How the usual R number can hide trouble spots
The authors start by examining how R is usually calculated from case counts. In practice, authorities often pool data from many regions into one big time series, then estimate a single R that reflects average transmission. This is convenient, but it assumes that all groups behave in a similar way. The study shows mathematically that the condition “R equals 1” can hold for an enormous variety of underlying situations, including many in which several groups already have strongly growing infections. In other words, even if the overall curve looks flat, some subgroups can be in full resurgence, and the usual R value will still confidently suggest stability.
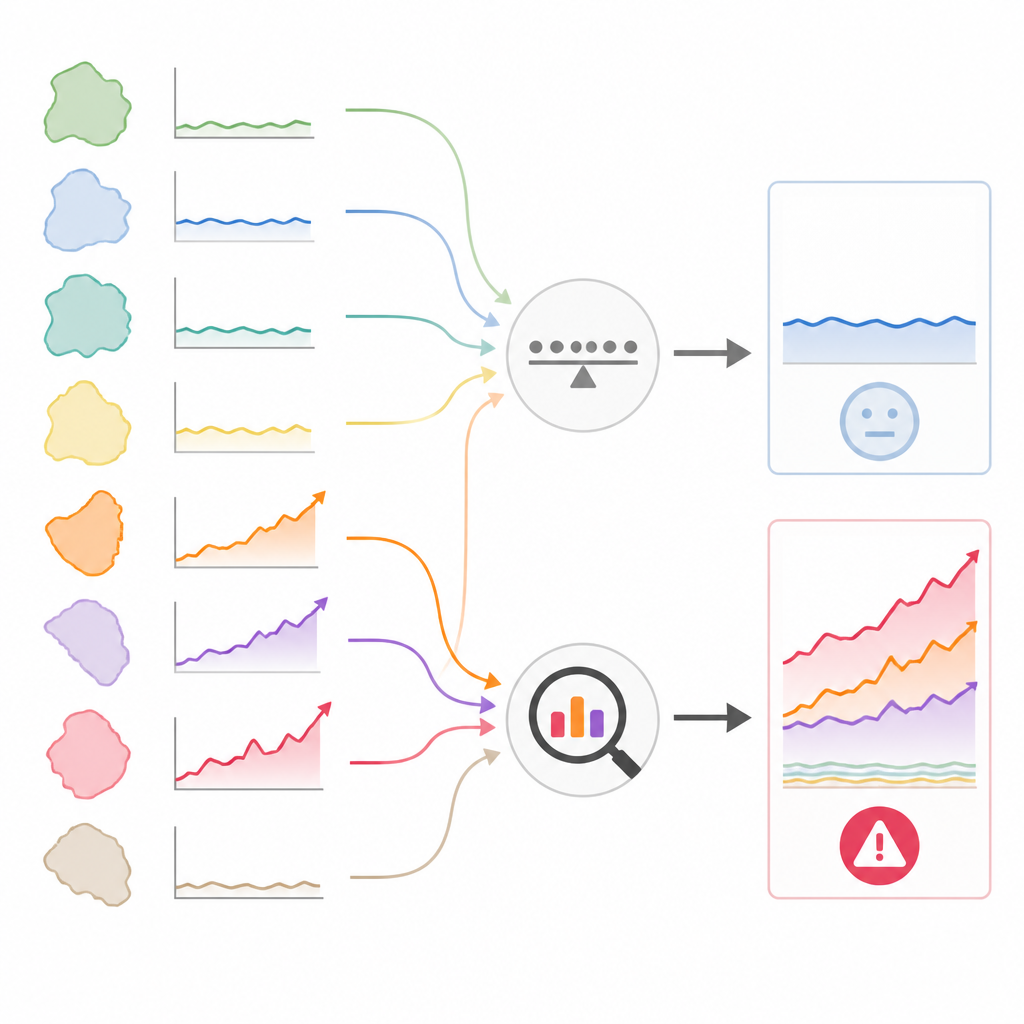
Why more detailed methods can overreact to noise
One response to this problem has been to use more advanced models that take group differences into account. A popular family of methods builds a kind of grid, or matrix, describing how infections move between types of people or places, and then looks at the most “dangerous” part of that grid. This maximum-based approach does prevent truly growing subgroups from being averaged away, but it swings too far in the other direction. Because it focuses on the single most active group, it reacts sharply to random bumps in small or noisy data. The paper shows that such methods frequently signal danger even when, taken as a whole, infections are not increasing in a meaningful way.
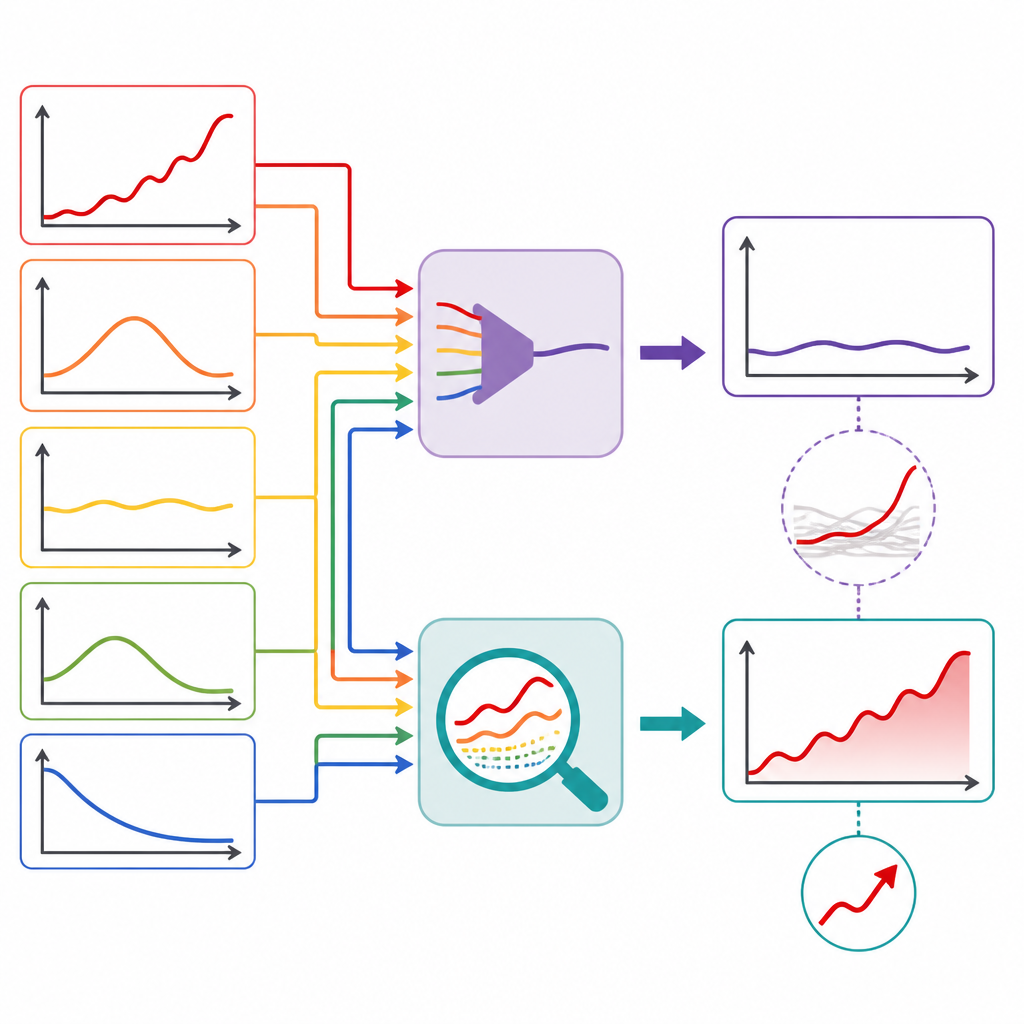
A middle path called the risk averse reproduction number
To strike a better balance, the authors place both the usual R and the maximum-based measure on a single scale of possible averages over groups. At one end is the standard R, which smooths everything; at the other is the strict maximum, which amplifies every fluctuation. Using ideas from experimental design, they identify a middle choice called the risk averse reproduction number, labelled E. This statistic gives more weight to groups with higher transmission, but not so much that random noise overwhelms the signal. The authors show, using theory and computer experiments, that setting the stability threshold at E equal to 1 sharply narrows the set of scenarios that can masquerade as safe, while still remaining robust to noisy case counts.
What the new measure reveals in real outbreaks
The team then tests these ideas on data from real epidemics. In simulated Ebola-like outbreaks split across two regions, there are periods where the combined case numbers appear flat and the usual R sits very close to 1 with narrow uncertainty, yet one region is clearly in renewed growth. In these same periods, the risk averse number E rises above 1 and its uncertainty widens, correctly hinting that the picture is more fragile than the headline suggests. Similar patterns appear in COVID-19 data from Italian provinces and US counties. At times when the overall R hovers around 1, some smaller areas are quietly ramping up, and E captures this by moving above 1 and signalling a higher chance that total infections will soon rise.
What this means for health decisions and public messages
For the general public, these findings mean that a reported R of 1 should not always be read as “safe and steady.” Because standard calculations often hide differences between places and groups, they can miss early warning signs of renewed spread until many more people are infected. The proposed risk averse number E provides a more cautious and informative threshold: when E is at 1, it is far more likely that most groups are genuinely stable; when E is above 1, it points to local flare-ups that deserve attention even if the overall curve has not yet turned upward. The authors suggest that, wherever detailed regional data are available, health agencies should complement or replace the usual R with E to guide timely, better targeted responses.
Citation: Parag, K.V., Santillana, M., Cori, A. et al. The R = 1 threshold can misclassify epidemic stability. Commun Phys 9, 185 (2026). https://doi.org/10.1038/s42005-026-02631-6
Keywords: epidemic stability, reproduction number, disease resurgence, COVID-19 modeling, public health metrics