Clear Sky Science · en
Deep-learning deconvolution and segmentation of fluorescent membranes for high-precision bacterial cell-size profiling
Why tiny cells matter
Most of us picture bacteria as identical specks, but their cells actually come in a surprising range of shapes and sizes. These differences in size can influence how bacteria take up nutrients, grow, and respond to antibiotics. Yet scientists have struggled to measure bacterial dimensions accurately across many strains because existing microscopy tools blur cell edges and merge neighboring cells. This study introduces a new image analysis pipeline, called MEDUSSA, that uses fluorescent dyes and deep learning to trace bacterial outlines precisely and compare cell sizes across thousands of cells and multiple strains.
Seeing cell edges more clearly
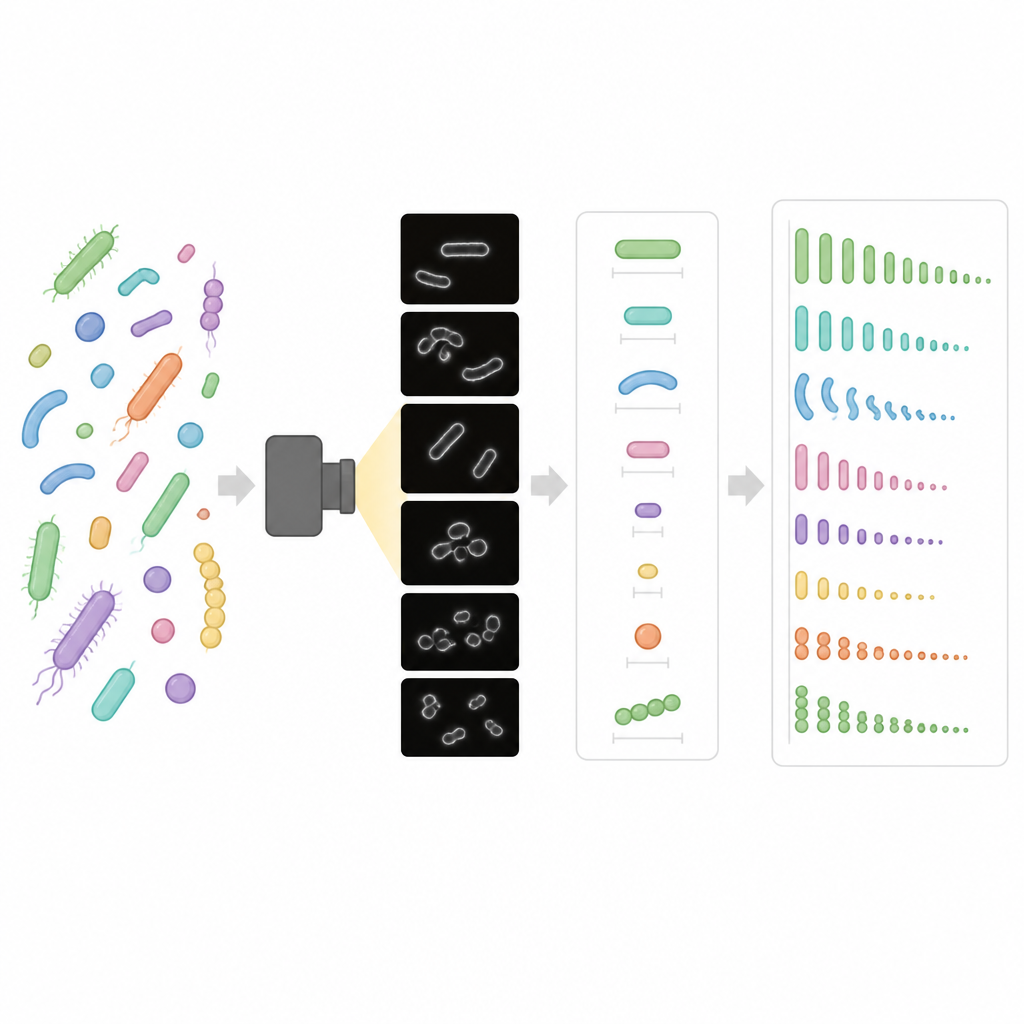
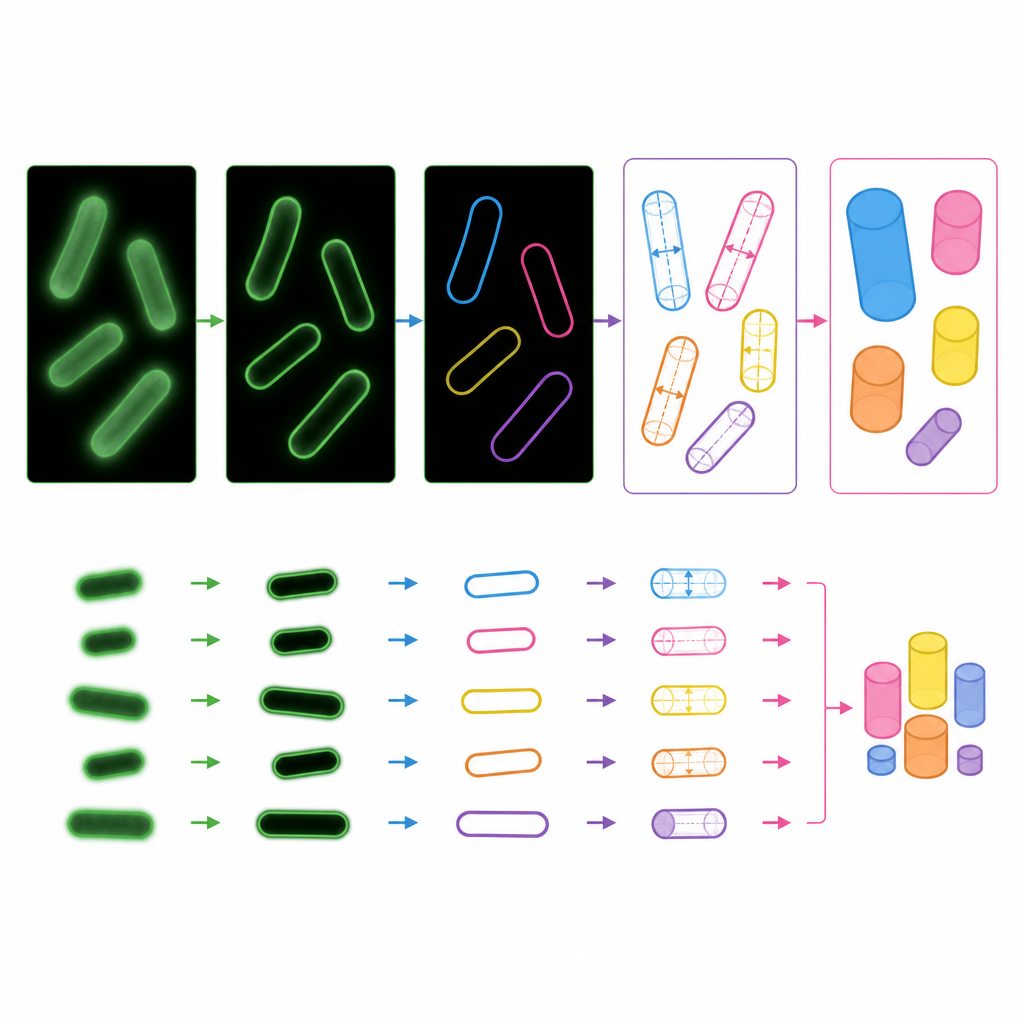
Traditional bacterial imaging often relies on phase contrast microscopy, which highlights cells without any staining. While convenient, this method makes it hard to see the exact cell boundary and impossible to tell where one cell ends and the next begins in long chains. The researchers instead stained cell membranes with fluorescent dyes, which produce a sharp bright ring around each cell and clear stripes where cells meet. This gave them an unambiguous visual guide to each cell’s outline, whether cells were isolated, clumped together, or arranged in chains.
Teaching computers to trace bacteria
To turn these fluorescent images into measurements, the team fine tuned several modern deep learning tools for image segmentation, the process of assigning each pixel to a specific cell. They trained these models on thousands of carefully traced bacterial cells and tested them on several species with different shapes and sizes. A model based on the Omnipose framework performed best once it was retrained on images that had first been sharpened by a process called deconvolution, which reduces blur from out of focus light. The optimized model, named FMSeg, could reliably separate single cells even in dense clusters, long chains, and very elongated forms, and it worked across diverse species and membrane dyes.
From flat pictures to real cell size
Segmentation masks alone do not give size, so the researchers built MEDUSSA, a measurement pipeline that starts from each mask and infers both two dimensional and three dimensional properties. For each cell, a central skeleton is drawn through the long axis and local radii are read out along this line, allowing the software to calculate width, length, surface area, and volume under simple geometric assumptions. The team discovered two important sources of error and corrected for them. First, cells in the same field often sit at slightly different heights, so they acquired image stacks through the sample and combined them into a single projection that captures each cell in focus. Second, their model tended to draw cells a bit too wide, but this overestimation was consistent, allowing them to learn a correction curve from high quality manual tracings and apply it to all automatic measurements.
Putting MEDUSSA to the test
To check accuracy, the authors compared their fluorescent based measurements with cell widths obtained from high resolution cryo electron microscopy of Bacillus subtilis, where cells are flash frozen and imaged in fine detail. The relative difference in width between normal cells and a thinner mutant was nearly identical with both methods, suggesting that MEDUSSA captures biologically meaningful variations even if absolute values differ slightly by around ten percent. They then used MEDUSSA to profile six strains of the large bacterium Priestia megaterium. Despite being closely related, these strains showed more than twofold differences in median cell volume, driven mainly by differences in width rather than length. Some strains also produced unusually long filamentous cells during active growth, highlighting previously overlooked diversity in cell shape.
Linking a thin strain to a single mutation
One strain, WH320, was strikingly thinner than its close relative DSM 319, even though WH320 was originally derived from DSM 319. Genome sequencing revealed dozens of small DNA changes, including one in a gene called ponA, which encodes a cell wall building enzyme known as PBP1. When the researchers introduced the ponA versions from the two Priestia strains into a Bacillus subtilis mutant lacking its own PBP1, the DSM 319 version restored thick cells, while the WH320 version only partially did so. This behavior indicates that the WH320 enzyme is weakened, and likely contributes to the narrow shape of that strain.
What this work tells us
By combining fluorescent membrane staining, deep learning based image restoration and segmentation, and careful geometric measurement, MEDUSSA turns raw microscope images into robust cell size statistics across thousands of bacteria. The study shows that even closely related bacterial strains can differ widely in width and volume, and that specific changes in cell wall proteins can help explain these differences. For non specialists, the key message is that bacterial cells are not all the same size, and with modern computational tools scientists can now chart this hidden diversity and begin to link it to genes, growth conditions, and evolution.
Citation: Reyes-Matte, O., Fortmann-Grote, C., Gericke, B. et al. Deep-learning deconvolution and segmentation of fluorescent membranes for high-precision bacterial cell-size profiling. Commun Biol 9, 693 (2026). https://doi.org/10.1038/s42003-026-10303-y
Keywords: bacterial cell size, fluorescence microscopy, image segmentation, deep learning, cell morphology