Clear Sky Science · en
The influence of nonlinear resonance on human cortical oscillations
Why brain waves are not as simple as they look
Brain recordings often look like wiggly lines on a screen, and many scientists treat these signals as if they were produced by a simple, mostly linear system. This assumption underpins many models of brain function and tools used to detect disease. The study summarized here asks whether that view is really correct, using a new way to tease apart the hidden structure of brain waves and reveal when the brain behaves in a more complex, nonlinear way.
Looking for hidden patterns in brain activity
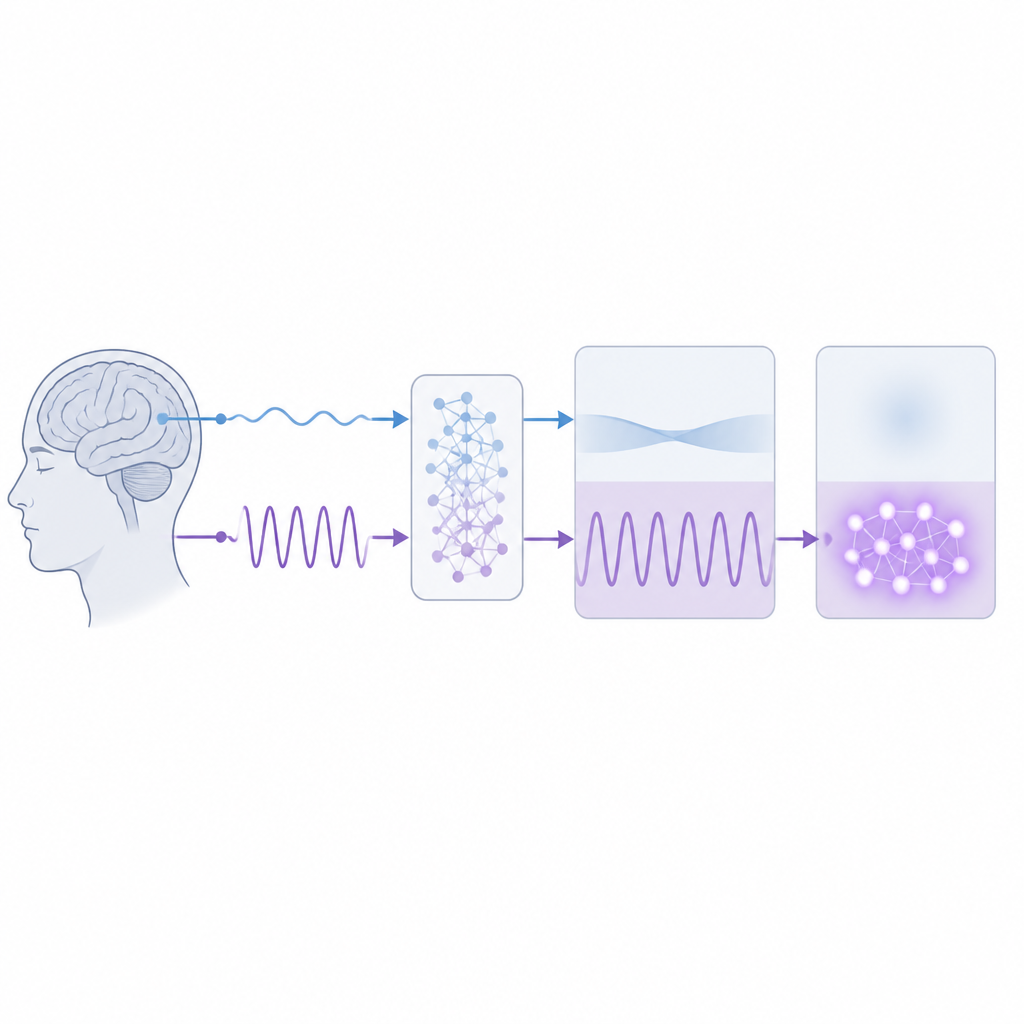
The authors focus on electrical signals from the human brain recorded either from the scalp (EEG) or directly from electrodes placed inside the skull (intracranial EEG). These signals are commonly split into two parts: a smooth background that spans many frequencies, and well known rhythmic peaks such as the alpha and mu rhythms. Traditional analyses examine how strong each frequency is, but ignore how different frequencies might lock together. The team argues that to understand whether the brain behaves linearly or not, we must look at how frequencies interact, not just how much power each one has.
A new way to separate background and rhythms
To tackle this, the researchers introduce BiSpectral EEG Component Analysis, or BiSCA. This method combines standard spectral analysis with a more advanced tool called the bispectrum, which captures how pairs of frequencies combine to produce new oscillations. BiSCA fits both pieces of information at once and then breaks the signal into an aperiodic component, called Xi, and a set of rhythmic components, called Rho, which include alpha and mu waves. Crucially, it can assign signs of nonlinear interaction to either the smooth background or the rhythms and can statistically test whether each behaves like a simple linear, Gaussian process or not.
Testing whether brain waves are really linear
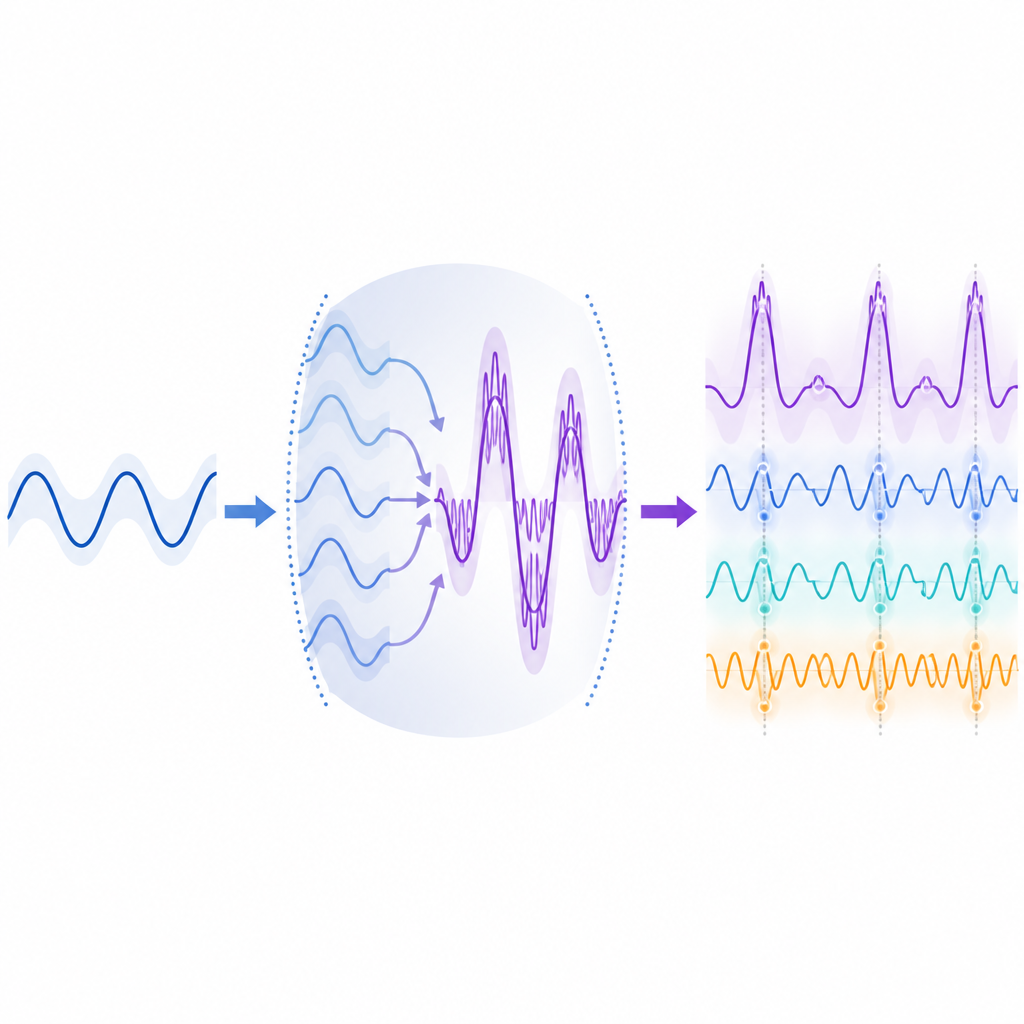
The authors first illustrate what their test is sensitive to by simulating two types of waveforms. In one case, the wave is symmetric and non-sinusoidal but does not show a particular kind of asymmetry that would produce even harmonics. In the other case, the wave is clearly skewed, with sharper peaks and slower troughs. Although both simulations look complex, only the asymmetric case shows strong signatures of quadratic nonlinear interactions when examined with the bispectrum. This demonstration shows that BiSCA is specifically tuned to detect a kind of nonlinear resonance where frequencies mix to produce new, related frequencies.
Nonlinear resonance lives in brain rhythms, not in the background
Applying BiSCA to large collections of human EEG and intracranial recordings, the team finds that most channels do not behave like simple linear, Gaussian noise at this quadratic level. Over 80 percent of scalp EEG channels and about two thirds of intracranial channels show either nonlinearity, non-Gaussian behavior, or both. When the signals are separated into their Xi and Rho components, a striking pattern appears. The aperiodic Xi background is almost always consistent with a linear, Gaussian process when examined with quadratic tools, while the Rho rhythms carry nearly all of the nonlinear signatures. In particular, rhythms in parietal regions classified as mu show especially strong nonlinear resonance, even more than the visually prominent alpha rhythm in occipital areas.
What this means for brain models and biomarkers
These findings challenge the idea that large-scale brain recordings can be fully captured by linear models. The background activity can often be approximated that way, but the rhythmic peaks clearly cannot. Instead, the results support a hybrid picture in which the aperiodic component arises from many weakly interacting sources that, taken together, look linear and Gaussian, while oscillatory circuits behave as nonlinear resonators that generate harmonics and cross-frequency coupling. For medicine and cognitive neuroscience, this means that useful information about brain state and disease may be carried not just in how strong a rhythm is, but in how its cycles interact and distort over time. BiSCA provides a principled way to capture this richer structure and could guide the design of more realistic models of brain dynamics and more sensitive brain-wave based biomarkers.
Citation: Wang, Y., Li, M., García Reyes, R. et al. The influence of nonlinear resonance on human cortical oscillations. Commun Biol 9, 605 (2026). https://doi.org/10.1038/s42003-026-10164-5
Keywords: EEG, brain rhythms, nonlinear dynamics, alpha and mu waves, bispectral analysis