Clear Sky Science · en
Moving from table to graph in physics-informed spatio-temporal symbolic regression
Teaching computers to uncover hidden rules of nature
Much of science boils down to finding simple rules that explain how the world changes over time, from a swinging pendulum to heat spreading through a metal rod. This article explores a new way to help computers rediscover such rules directly from data by paying attention not only to the numbers themselves but also to where and when they were measured. The work shows how combining two views of data, a traditional spreadsheet view and a network view, can make automatic discovery of equations more accurate, more robust to noise, and closer to real physics.
From spreadsheets of numbers to webs of connections
Most current tools for automatic equation discovery treat data as a plain table, where each row is an independent measurement. That setup works for simple problems but struggles with real physical systems, which evolve both in space and time. A temperature reading at one point depends on its neighbors and on what happened a moment earlier. Ignoring these links can lead computers to produce formulas that fit the data but miss the actual underlying law. The authors argue that to respect how nature works, we need a representation that keeps track of which measurements are neighbors in space and time, not just their raw values.
Turning measurements into a space time network
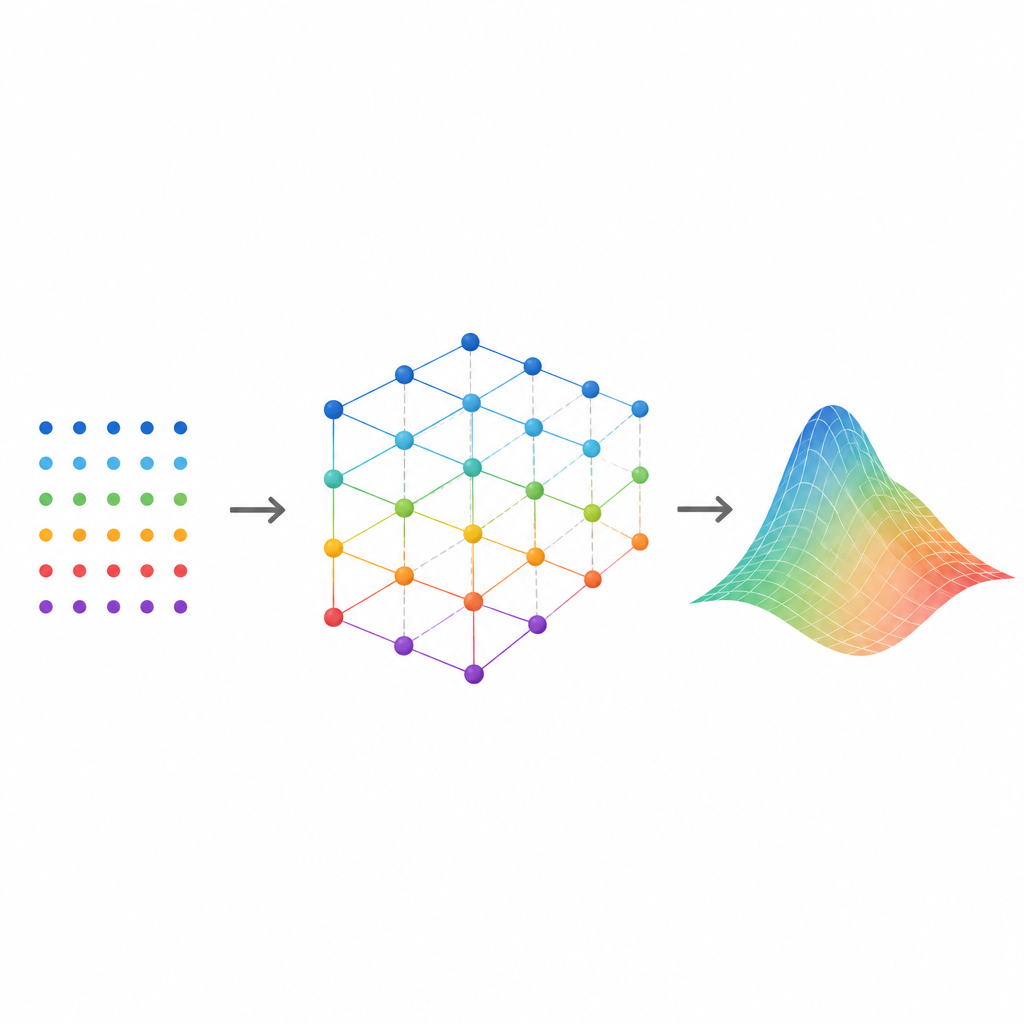
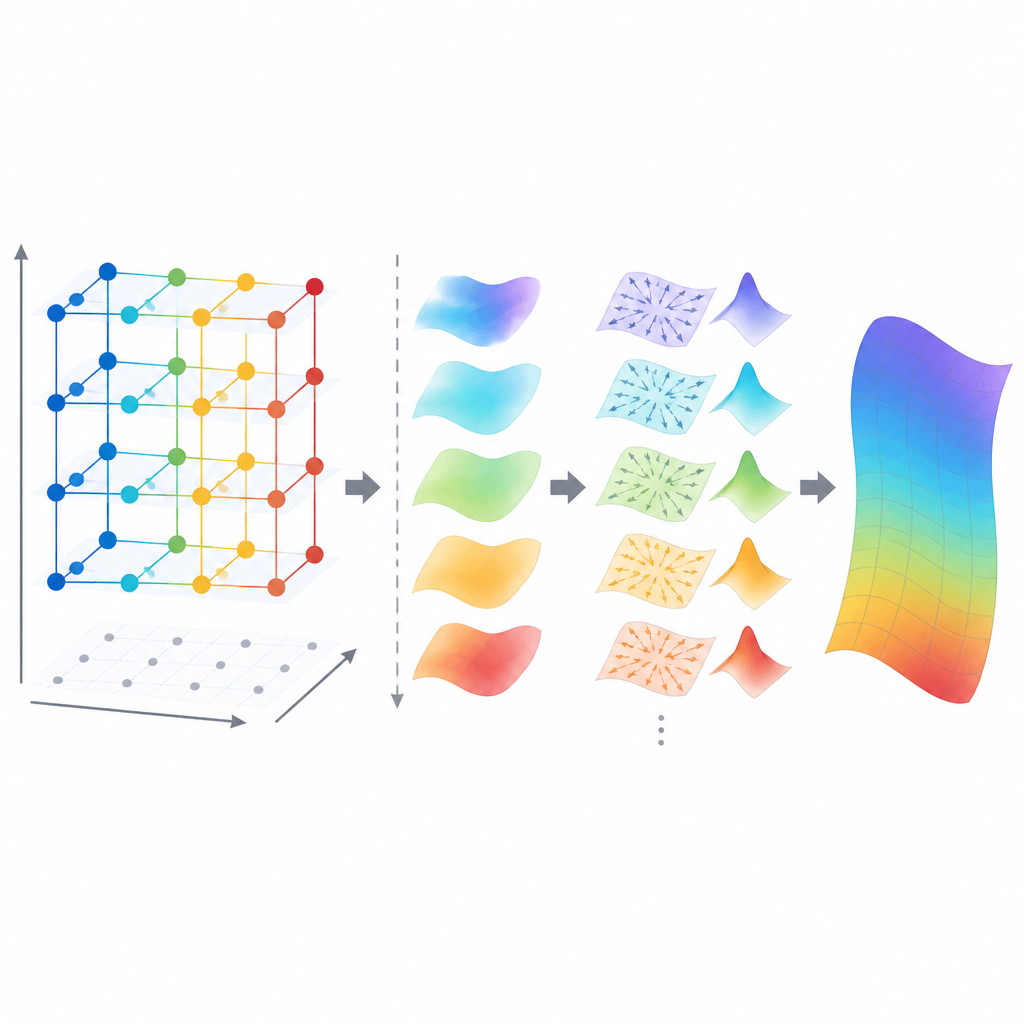
To fix this, the study introduces a dual representation of data. The first view is the familiar table of numbers. The second view is a graph, a network whose nodes correspond to measurements taken at specific locations and times, while edges link readings that are close in space or in time. This graph acts as a map of local cause and effect, where differences along spatial edges mirror spatial changes and differences along time edges mimic rates of change over time. A graph based neural network then processes this structure to learn compressed, physics aware features that highlight smooth, consistent patterns and downplay random noise.
Teaching equation finders to listen to physics
Once these learned features are available, they are plugged into symbolic regression tools, which search for human readable equations that describe the data. The key innovation is a new training objective that judges candidate equations in two ways at once. First, it checks how well simulated data from a candidate matches the original measurements. Second, it checks whether the simulated data, after passing through the graph neural network, lands in the same “latent” space as the real data. This second check forces the discovered equations to respect the spatial and temporal relationships captured by the graph, nudging the search away from formulas that fit the numbers but break known physical structure.
Putting the method to the test
To see how well this idea works, the authors generated synthetic data from ten classic equations drawn from physics and engineering, including laws for springs, heat flow, fluid like motion, and systems with delayed responses. For each case they added extra distracting signals and controlled amounts of noise, then ran ten different equation finding methods both with and without the new graph based representation. Across the board, using the dual view led to modest but consistent gains in accuracy, better recovery of the correct symbolic form, and closer adherence to physical constraints. The benefits were most striking when the data were noisy or scarce, conditions that often arise in real experiments.
What this means for future scientific discovery
In simple terms, the article shows that giving computers not just the numbers, but also a sketch of how those numbers are related in space and time, helps them guess the right equations more reliably. By weaving a network view into otherwise standard equation discovery tools, the method improves robustness without changing the inner workings of those tools. While the tests here use carefully controlled simulated data, the approach suggests a practical path toward more trustworthy, physically consistent models from limited measurements, bringing automated equation discovery a step closer to everyday use in laboratories and engineering practice.
Citation: Lazebnik, T., Liberzon, A. Moving from table to graph in physics-informed spatio-temporal symbolic regression. Sci Rep 16, 16016 (2026). https://doi.org/10.1038/s41598-026-53882-w
Keywords: symbolic regression, graph neural networks, spatio-temporal data, equation discovery, physics-informed learning